.png)


Updated October 2025: This blog has been updated to provide the most up to date information. It was written after the June 2025 update where the question was whether we can build reports in the Power BI Service as we do in Power BI Desktop, but as some elements where late to roll-out we have now updated it to have the latest information.
If you work with Power BI, you're probably familiar with the fact that all the "magic" happens inside Power BI Desktop. But what do I mean by that? Simply put, all development work, whether it’s data ingestion, transformation, modelling or report creation, has traditionally been carried out within Power BI Desktop.
However, over the years, Microsoft has been bridging the gap between Power BI Desktop and Power BI Service (browser-based experience: app.powerbi.com) by bringing a lot of features from Desktop into the Service. This move is aimed at providing parity between the two environments.
So, why would Microsoft want to do this? For me, the main reason that comes to mind is access. By moving more development capabilities to the Power BI Service, Microsoft is making these accessible to a wider range of users, including those on non-Windows machines. The most obvious example? Mac users.
Side note, if you are a Mac user and want to use Power BI Desktop, check out this blog: Can I Use Power BI on Mac?
With this change, it means we could now (potentially) ingest, transform, model and report all from the Power BI Service, without needing Power BI Desktop installed.
In this blog, we’ll explore the standard development process when building a solution from scratch in Power BI Desktop and dive into how far we can go with the Power BI Service for a fully browser-based authoring experience.
Core Elements for End-to-End Experience in Power BI Service
Before we start, what are the core elements I believe we must have in the Power BI Service to truly offer the same end-to-end authoring experience as we have in Power BI Desktop? Well, it’s the following:
- Get Data: The ability to start with a blank canvas, so a new PBIX, not an existing solution already published. From here, we can select the data sources to ingest into the solution.
- Transform Data: The ability to have the same Power Query (Data Transformation) experience as we have in Power BI Desktop, for the ingested data.
- Model Data: The ability to see the queries (tables) loaded from Power Query in the "Model view", establish relationships and to modify some of the properties.
- Write DAX: The ability to write DAX calculations in the required tables that have been loaded, such as measures, calculated columns and calculated tables.
- Report: The ability to build a report on top of the semantic model which would have been developed by following the above steps.
So, the above five points are what I want to be able to see in the Power BI Service to truly say we have that end-to-end authoring experience, as we have it in Power BI Desktop.
A Few Key Considerations
Now, before diving into all of this, I just want to be clear on three things.
Firstly, we should not expect to have absolutely everything in the Power BI Service from the start. It will take time. However, if end-users are to begin using the Power BI Service more or if new users (non-Windows) are to have the same experience as Desktop, the core elements and features are necessary. My personal opinion is that it will be a lot harder to move Power BI Desktop users to the Service (not saying this is the aim of MS), rather than new users who have never used Desktop. Why? Well, I myself would ask "Why move to an experience that is similar, but with more limitations?". Also, I like to explain it like this, I can use all of the MS Office products in the web, yet I still prefer the desktop versions. Why so?
Secondly, we need to understand there are different personas in Power BI: report consumers, report authors and semantic model designers. Each of them would want a separate experience or set of features, so not everyone needs the entire end-to-end experience. However, in most organisations I’ve worked with, the report author and semantic model designer are the same people - the above five would be relevant to them.
Lastly, I am looking at this from a pure Power BI lens and also with the aim of replicating the experience as we have it in Power BI Desktop. For example, yes, I understand we have Power Query in the Service through Dataflows. However, if non-Windows users have to rely on Dataflows, I wouldn’t say that’s the same end-to-end experience as in Power BI Desktop. Also, with MS Fabric it is possible to get additional elements but again, that is using the other experiences within MS Fabric, not Power BI.
Below, we will now explore these five points.
1. Get Data: Ingesting Data from Source
In Power BI Desktop, the starting point is pretty straightforward, as shown in the screenshot below. When you open Power BI Desktop for the first time, you’re greeted with an empty canvas, no data, no visuals, just a blank slate. From here, you’re free to choose your next steps based on your needs. For instance, if you're looking to create a new semantic model, simply click "Get Data" to start ingesting your data. Alternatively, if you're building a report based on an existing semantic model, you can go straight to the "OneLake catalogue", select "Power BI semantic models" and dive straight in.

The goal is to bring the same experience to the Power BI Service. Until recently, we haven’t had that parity. When you go into the Power BI Service and click "Create" you were presented with very limited options, as shown below. Notice, we could only select from "Excel (Preview)", "CSV (Preview)", "Paste or manually enter data" or "pick a published semantic model". This did not offer the same experience in PBI Desktop. Also, when working in Desktop, once you select your data source you naturally have the option to click "Transform data", which gives you full access to Power Query. However, for all the options displayed in the below screenshot, you don’t get the same Power Query experience as you do in Power BI Desktop or even through Dataflows in the Power BI Service.

However, this is no longer the case. Notice, the below screenshot. We now have the "Get Data" option. How great is that?! We always had "Get data" in the PBI Desktop and we now have it in the Service. This is the step before Power Query for data transformation.
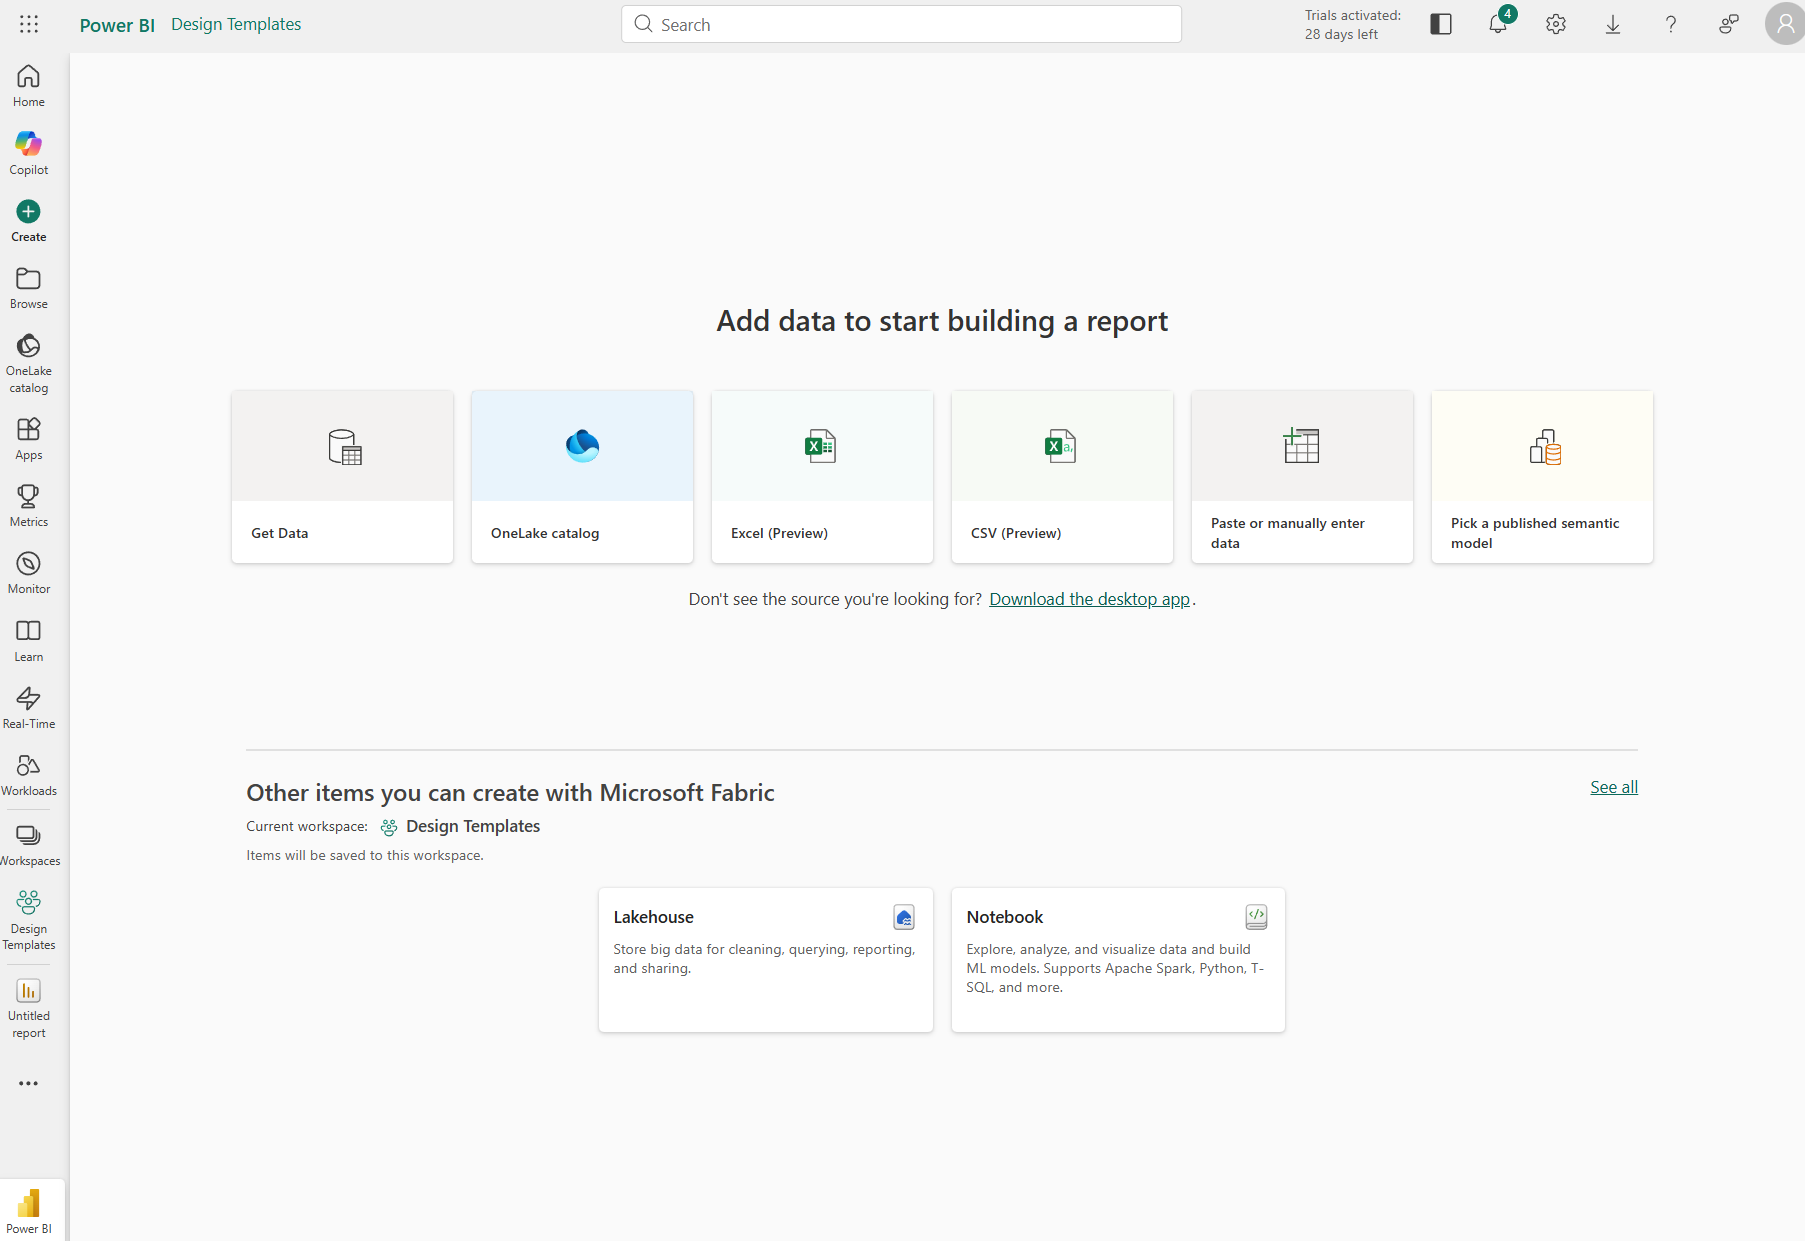
Power BI Service - New "Create" View
Power BI Service - New "Create" View
This now takes us nicely into the next element, Transform Data, where we dive into the data shaping and cleaning process.
2. Transform Data: The Power Query Experience
In the below screenshot, we see a view of Power Query in Desktop. So, after you click "Get data", you have the option to select "Transform data" and this is what you will be presented with. But, as explained above, we now have the "Get data" button in the PBI Service.

So, as part of the June 2025 Feature Summary Update, we had: Power Query editing in the web for import models (Preview). So, Microsoft have here said:
"Since launching data model editing in the Service, you’ve told us Power Query was the final missing piece to unlock a truly complete, end-to-end authoring experience in the browser. Beginning this month, it will be possible to get data, transform data, and refresh your import models entirely on the web, with no need for Desktop."
Two things to pick from the above: (1) end-to-end authoring experience in the browser and (2) with no need for Desktop. This is exactly the scope of this blog and I’m very happy this feature is now here.
When we select "Get data" now, we are presented with the "modern Power Query 'Get data' experience" (as per the MS Documentation).
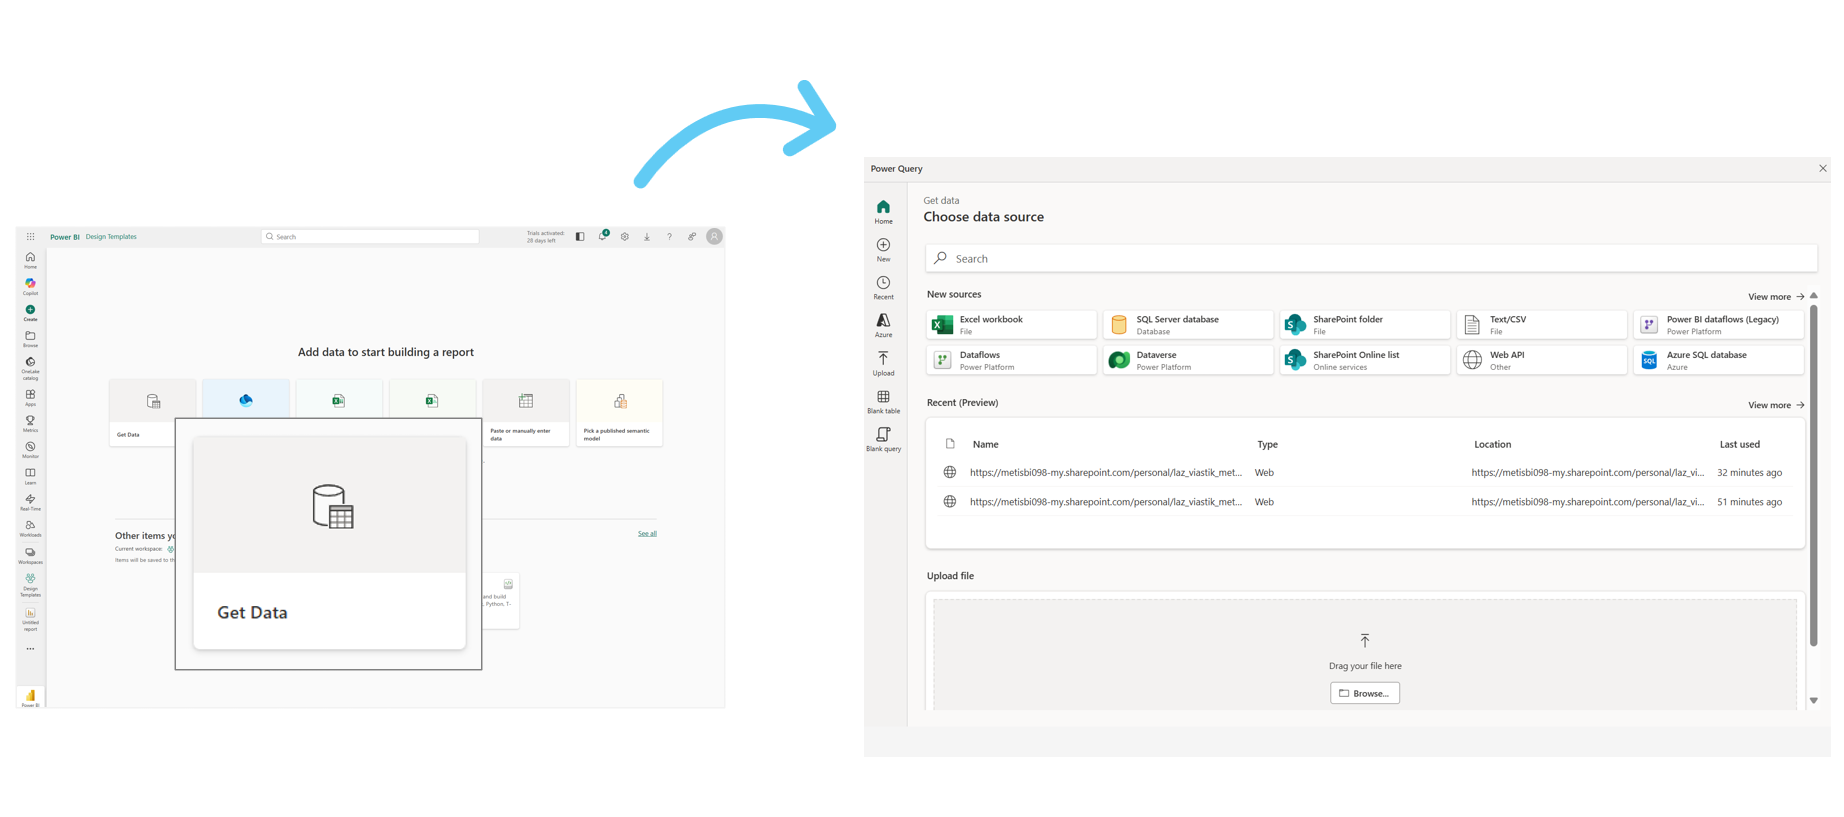
From the above, I selected a CSV file to test this out and below is the result. We now have the same experience in the Power BI Service. We can select "Get data", select the appropriate connector and it will take us to Power Query, it allows us to create a new semantic model from newly ingested data. Before, this was simply not possible in the Service.
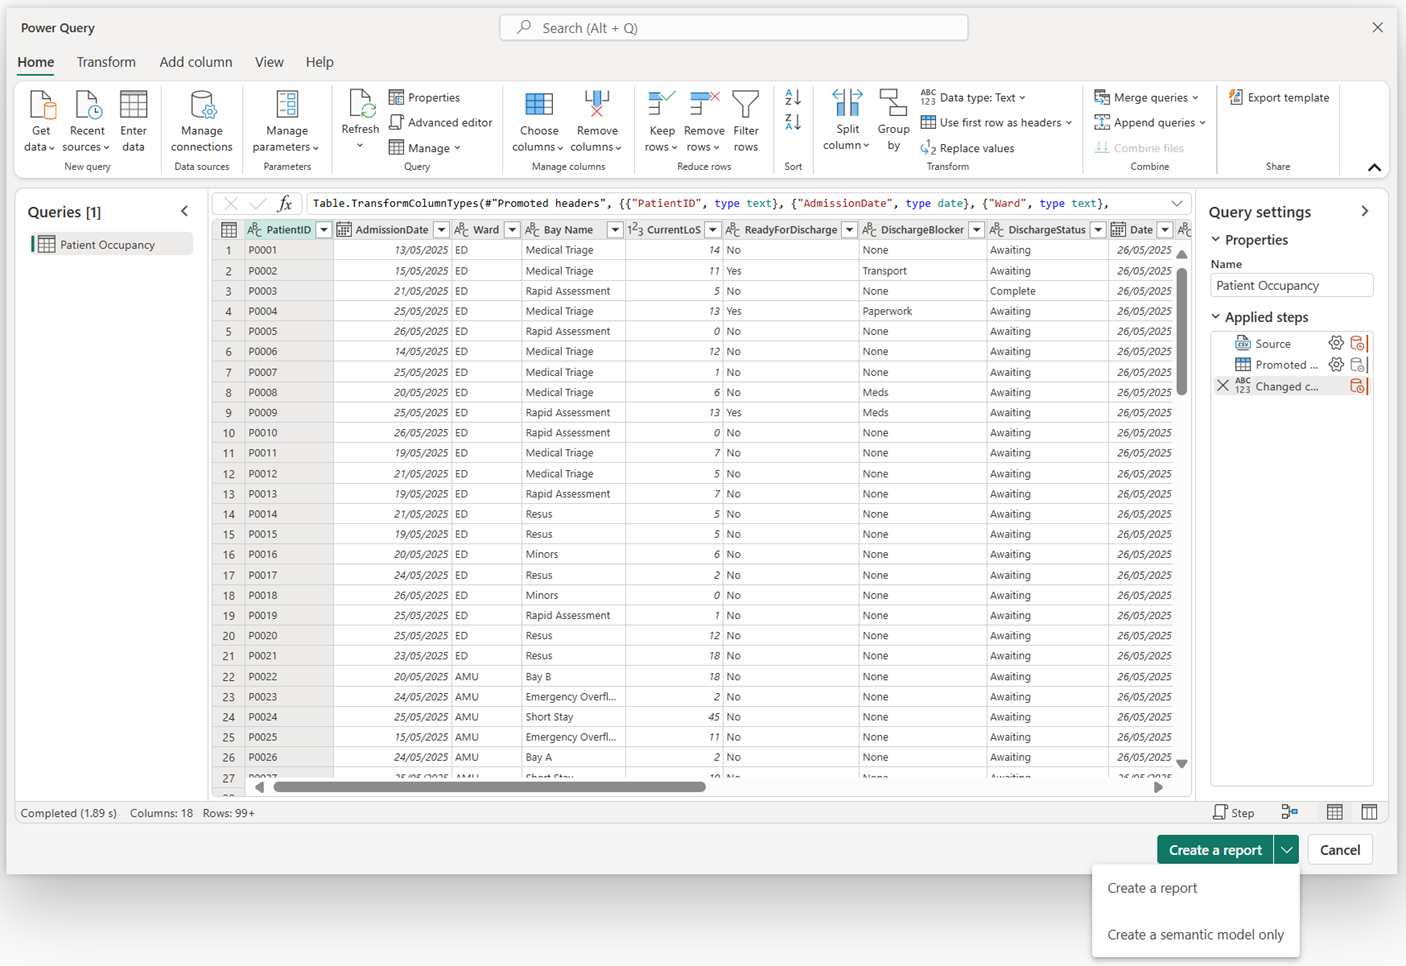
I also ingested an additional source (Excel for Regional Data), entered a blank query and updated the M code through Advanced Editor (Date).
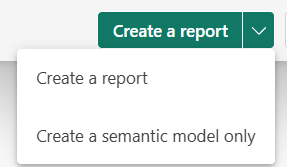
So, its safe to say the experience is here, but there are limitations such as not able to select other storage modes apart from Import. For a full list of limitation on Power Query in the PBI Service, check this link here by Microsoft. In the new "Get data" experience , you may have noticed we have two options of "Create a report" and "Create a semantic model only" as displayed below:
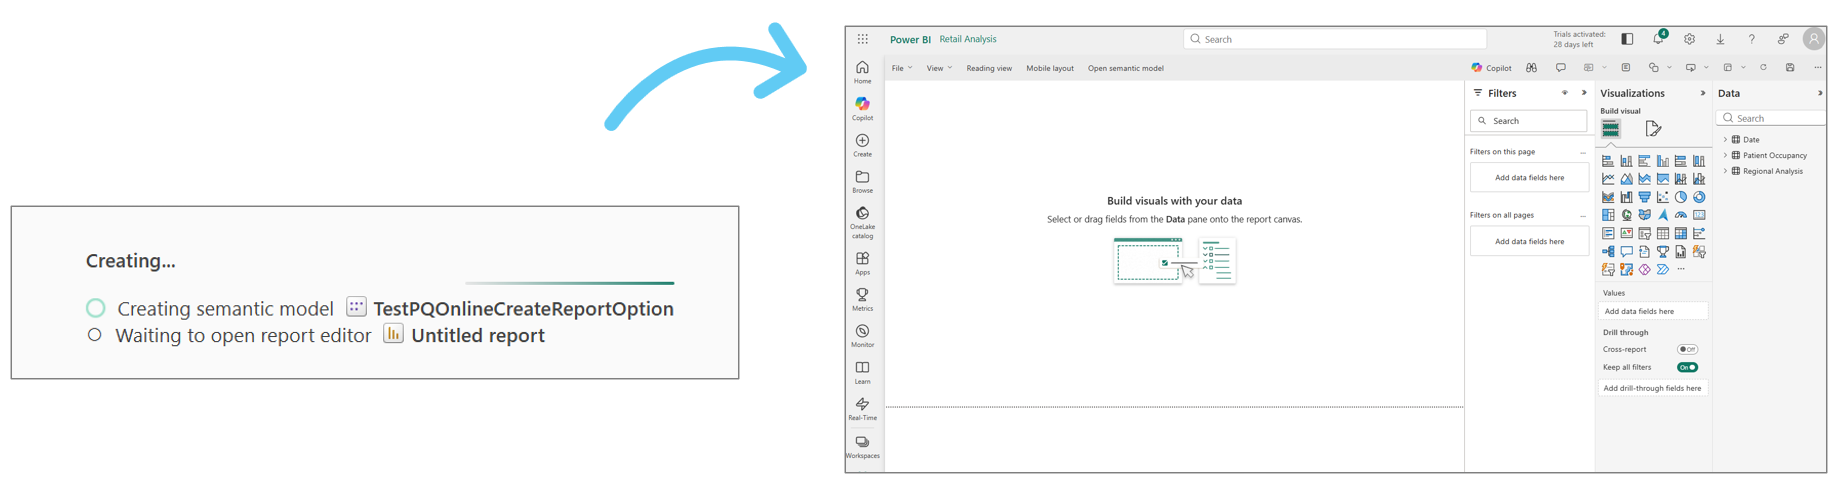
If you select "Create a report", it will first ask you to select a workspace, name the semantic model and save it. You will then see: (1) Creating semantic model status/Waiting to open report editor status and (2) the Power BI canvas will display for you to create your report. However, we missed the steps of modelling our data and creating DAX measures when selecting "Create a report".
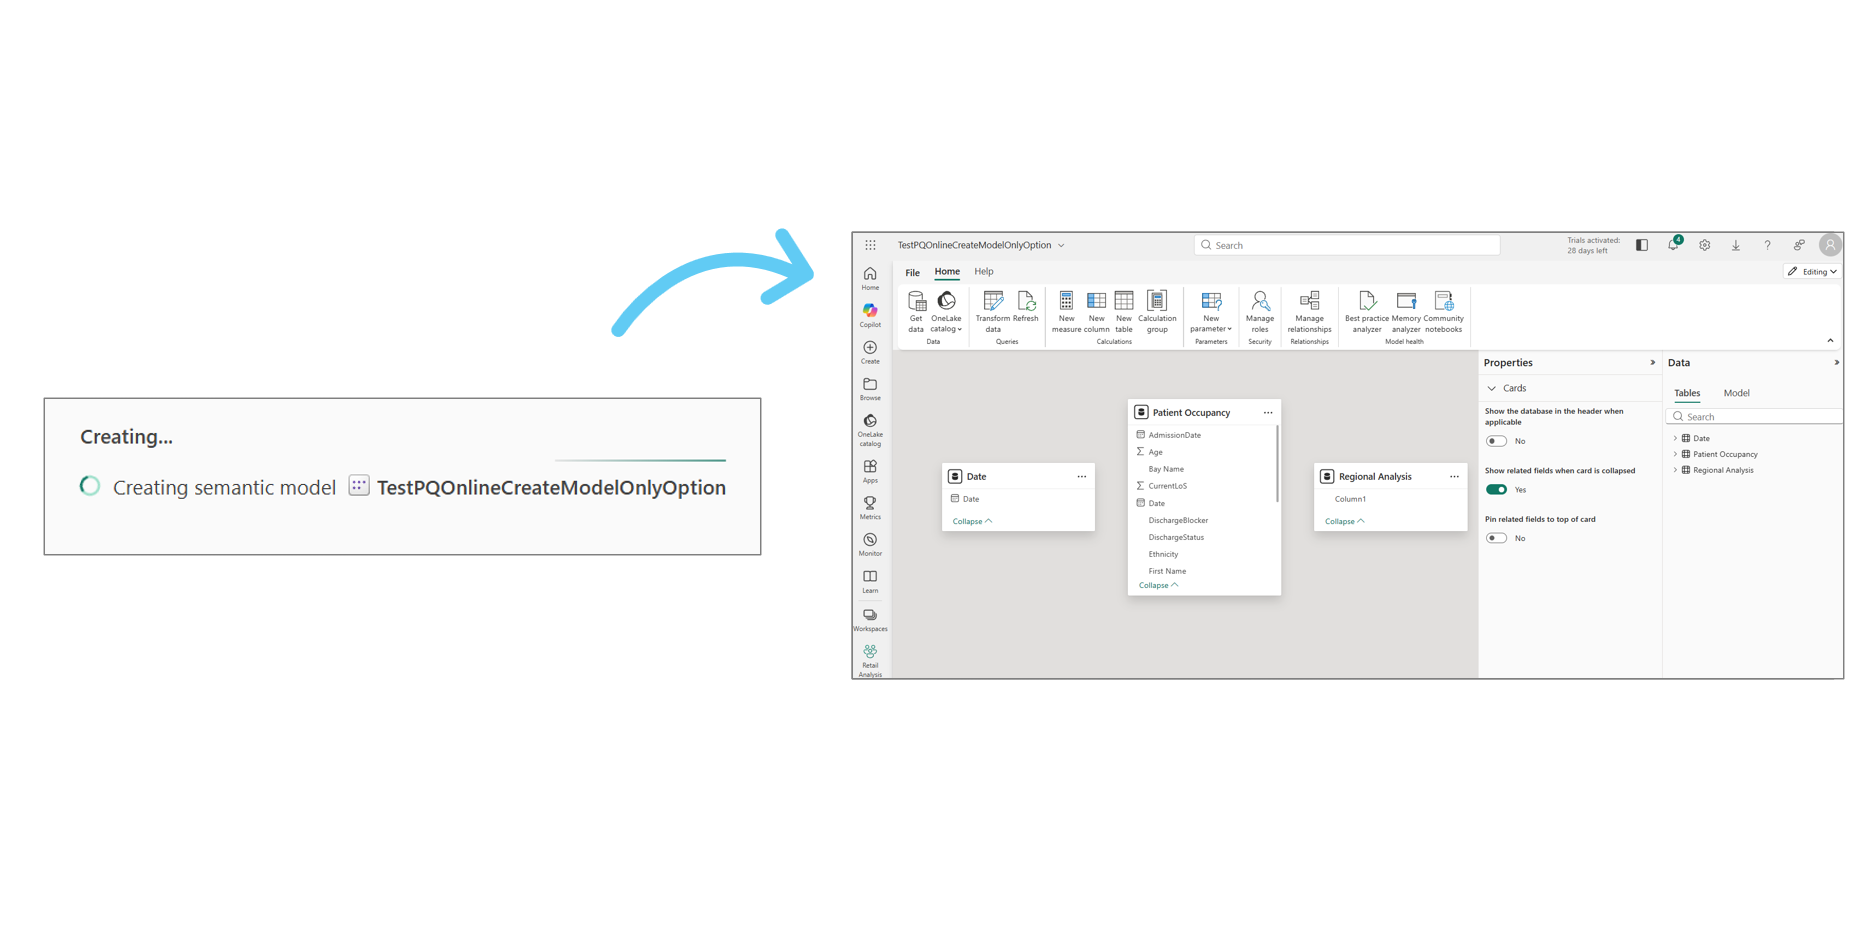
If you select "Create a semantic model only", it will again first ask you to select a workspace, name the semantic model and save it. You will then see: (1) Creating semantic model status (no mention of report) and (2) the Power BI model editor will display. This shows how we have a much more complete experience in the PBI Service. More on data modelling below.
3. Model Data: Building Relationships and Structuring Your Model
Picking up from where we left off in the Transform Data section, once your data is ingested and transformed, the next step is to model it. This is where you define the structure of your data, creating relationships and ensuring that all your data is connected in a way that allows for meaningful analysis. Below is a screenshot from Power BI Desktop:

Here, you can see your transformed data in the "Model view", establish relationships between tables, define hierarchies, modify properties with full flexibility and much more. But when it comes to the Power BI Service, the experience is somewhat different.
The Power BI Service allows you to model data (which is great), but with some limitations. Modelling only works on an existing, already published semantic model, which makes sense because, as we discussed earlier, the "missing piece" until now was the Power Query transformation capabilities. To model your data as a second step to transforming, you need data that has already been ingested, transformed and loaded into the model. With the upcoming June feature (which we'll dive into once it's fully rolled out), this might change, enabling a full end-to-end authoring process directly in the Service, but for now, you’re working with what’s already been published. For me, that is not the same!
Let's go ahead and open up the semantic model in the Power BI Service. Below, is one of my showcase solutions for healthcare - Green Valley Bed Capacity. If I want to edit the data model, I can simply select "Open data model" as displayed below. Of course, there are other ways to be able to access but for now, this is the way I am showing.

Quick side note: If the "Open data model" button is greyed out, hover over it and you should see an explanation of why. It’s most likely because this feature hasn’t been enabled. In a standard workspace (not, My Workspace), you’ll need to go to "Workspace settings" and ensure the option "Users can edit data models in the Power BI service (preview)" is selected, as shown in the screenshot below. Additionally, there’s an option in the Admin Settings that must be enabled to allow users to edit data models in the Power BI Service. If it's not enabled, you’ll need to contact your MS Fabric Tenant Admin to get it set up.

Viewing vs Editing Mode
After you click on "Open data model" you’ll find yourself in "Viewing mode" (thankfully). This is an important distinction, as Viewing mode ensures that you can safely explore the model without the risk of making accidental changes. This mode allows you to adjust things like diagram layouts, but any changes made here won’t be saved, which is important for preventing unintended edits.
Now, Editing mode is where you can actually make changes to the model, like creating relationships, modifying tables, and adding measures. It's essential to be cautious when switching to Editing mode, as any changes you make will be applied instantly. For this reason, it’s especially important to ensure that you're in Editing mode only when you intend to modify the model. From what I could see, there is no undo button - which I don’t like! Version control is really important here, so will mention it further below.

Model View: Desktop vs Service
Below a side-by-side comparison of the same solution in Power BI Desktop and the Power BI Service. Looking at them, they’re definitely well aligned. However, there are some key differences and elements worth highlighting. Note that I’m purposely leaving DAX out for now, as that will be covered in the next section.

In both environments, we can:
- Create relationships and manage all relationships, making any necessary edits.
- Modify properties for both tables and columns, such as hiding tables/columns and changing column data types.
- Mark a calendar table as a date table, which is crucial for time-based analysis.
- Configure Row-Level Security directly in the model, including setting up both roles and rules.
- Create both numeric and field parameters.
- Create new model layout (tab) to help organise and focus on specific parts of the model.
With that said, keep in mind there are still several limitations in the Power BI Service. For example, you cannot see the "Table view" as we have in Power BI Desktop which is the tabular view of the data. Also, you cannot open data models that have incremental refresh configured or those with a live connection. Additionally, features like "feature tables" (who actually uses that?) are not available, among a few others. You can explore more of these limitations: Edit data models in the Power BI Service (preview).
Version Control: Keeping Track of Changes in the Power BI Service
Now that we've explored some of the modelling capabilities in the Power BI Service, it’s time to dive into version control. I used to be quite firm on this, making changes in the Power BI Service just didn’t seem right and it was an easy conversation. The version control features we have today simply weren’t available back then, so all development was done in Power BI Desktop. Also, it's not as if we can just choose to save the PBIX from the PBI Service as we can in PBI Desktop. But, with more available options now in the Service, we can rethink this stance. One of the features is: Use semantic model version history (preview).
Think about users in the Power BI Service making changes to their semantic models. Inevitably, there will be times when you need to revert to a previous version due to a mistake made during the editing process. That’s exactly what semantic model version history helps with. It’s built for self-service users, offering an easy way to restore a previous model version if things go wrong. The best part? It’s automatically configured when you edit models online, so there’s no need to manually set it up.
This feature is designed to empower users, especially those without deep technical expertise, by providing a safety net during the editing process. While it’s great for individual users, there are some important limitations to keep in mind:
- Only the last five versions of the model are saved.
- You can only restore versions from the last 14 days.
- It’s not as comprehensive as traditional enterprise-level version control.
For those working with larger teams or in enterprise environments, you’ll need a more robust version management solution for your enterprise solutions. In those cases, you can use Git for version control to track changes made in the Power BI Service, as long as your workspace is linked to a Git repository. I’ll be diving deeper into Git integration in a separate blog coming soon.
One more point or concern I have is this. What happens if two people edit the same semantic model in the Power BI Service at the same time? I haven’t tested this myself, but I assume the last person to save their changes will overwrite the others, while the previous version will be captured in version history.
4. Write DAX: Calculating Business Logic with DAX
We’ve now arrived at DAX!
Now, I usually group DAX under data modelling, but I’ve purposely separated it out here to be super clear about what I expect to see in the Power BI Service for a true end-to-end authoring experience.
For those who don’t know, DAX (Data Analysis Expressions) is layer where we define KPIs, business rules, calculations and all the key metrics that drive insight. Think the equivalent of Excel formulas, but for Power BI and much more powerful.
Below, you can see a side-by-side comparison of the DAX query experience in Power BI Desktop and Power BI Service:

Honestly, they’re almost identical and that’s great to see. You can write DAX in a clean editor, you get IntelliSense, autocomplete, formatting… everything. If you want to know more about the DAX Query View, and things to keep in mind for the web browser experience, click here: DAX query view - Power BI | Microsoft Learn.
Below you will see the "Model view" as you saw in the previous section, but notice this time I highlighted the ability to create measures, calculated columns and tables:
- Create measures directly from the ribbon by selecting a table and clicking New measure
- Create calculated columns the same way by selecting the table, click New column, write your logic
- Create calculated tables using by selecting New table

Remember, each of these will appear instantly in your data model. If you’re used to working in Power BI Desktop, I feel like we have majority of what we need from a DAX side - minus Performance Analyzer pane which I would love to see. For those who are new, the good news is that you’re not missing out here. DAX authoring is well supported by the looks of it.
5. Report: Designing Visuals on Your Semantic Model
We’ve now arrived to the final element of exploring whether the same end-to-end authoring experience we know from Power BI Desktop can be replicated in the Service. Reporting!
When thinking about building in the Power BI Service, reports should come first to mind and in all honesty where available to do for quite some time now. So, how can we start creating reports?
Well we can click "+ New Report" and we will see the option to select a published semantic model. Also, from the semantic model, we can select "Explore this data" which will give us the below three options:
- Auto-create a report: Automatically generates a basic report using key fields from the semantic model.
- Create a blank report: Opens an empty canvas to manually build your report with data from model.
- Create a paginated report: Opens the paginated report editor, ideal for print-friendly, PDF-style reporting.

Let’s now take a look at how the Power BI Service compares to Power BI Desktop when actually building reports.

The side-by-side screenshots below show the experience of both creating a blank report and editing an existing one. At first glance, the layouts are incredibly similar, from the visualisations pane to the filters and formatting options.
If you see below, the Power BI Service now also includes many familiar design tools:
- Smart guides, gridlines and snap to grid help align visuals
- Selection, Bookmarks and Sync slicers panes are all available
- You even get access to Copilot and Insights panes for assisted analysis
Beyond that, you get pretty much everything else you’d expect, edit interactions, mobile layout, shapes, buttons and more. So yes, it’s possible to build full reports straight from the Power BI Service. In fact, I’m going to push myself and build my next showcase report entirely in the Service. I’ll come back and update this blog with how it went.

Even though most of the functionality is now available, the overall feel in the Service is still different. That’s probably down to habit though, as I’ve used Power BI Desktop for years. The ribbon layout, panes and the lack of tab-style switching between Report, Model and Table views just make it feel… less familiar. But like I mentioned earlier, I actually think new users will take to this quickly. It’s those of us who’ve spent years in Desktop that might need a bit more time to adjust.
Final Thoughts: Are We There Yet?
So, do we now have the same end-to-end authoring experience in the PBI Service that we’ve had for years in Power BI Desktop? Yes, as we have the core elements I highlighted at the beginning of this blog which are: Get data, transform data, model data, write DAX, and report. Please, as mentioned above, do consider the limitations that exist which again can be found here in the MS documentation. With the above said, we’re not there just yet. The UI still feels a bit off, especially if you’ve spent years developing in Power BI Desktop. Some features are missing or limited, and it’s not quite a one to one experience. But you have to give it to Microsoft and the Power BI team as its come a long way. Need more help? We offer Power BI Training!


.png)
.avif)
.png)