


.png)


A fact table is not just where numbers go. I mean, yes... it contain the numerical attributes (amongst others things too), but It represents a business process at a clear grain and I like to say the grain comes down to one plain sentence: What does one row represent? Get that sentence right early and the rest of the model follows.
So, this topic comes up a lot for me. Every time I sit down to design and structure a data model, in most of the conversations I have with my clients BI teams or data teams, it comes to Fact tables... naturally! That is why I wanted to write it down here as a blog.
A quick note on scope. This blog is about the difference and choosing between fact table types, not about the basics of what a fact table, a dimension or a wider data model is. If you want that groundwork first, what a fact table is, how it differs from a dimension and why the star schema matters, that is all in our blog on data modelling in Power BI. This blog picks up where that one left off, where I said to design around a core business event or process, and goes a level deeper into the shapes a fact table itself can take. If you are building these tables in a Fabric warehouse specifically, Microsoft's guidance on modelling fact tables covers more the T-SQL side.
Also, one thing we are super open (and proud of) about at Metis BI. When it comes to data modelling we know our Kimball vs Inmon, we follow Kimball all the way when it comes to modelling in Power BI and MS Fabric. Everything in this blog sits on the Kimball dimensional modelling approach, so if you want to go to the source, the Kimball Group is where to start and also recommend the book: The Data Warehouse Toolkit.
%20(1).png)
Summary
A fact table represents a business process and its grain is the answer to the question: what does one row represent? To offersome more detail, a fact table holds the numeric measures you count, sum and average, the numbers that answer your WHAT type questions, together with the foreign keys that join to the primary key in each dimension. Quick note, and we will come this more below, the factless fact is the exception, carrying those keys with no measure at all. Now, the four shapes we will explore in this blog (and worth knowing) are the transaction fact, the periodic snapshot, the accumulating snapshot and the factless fact. Each answers a different kind of question, from "what happened?" to "did this happen at all?". Choose the shape from the business process and the question being asked, not from the shape of the source table.
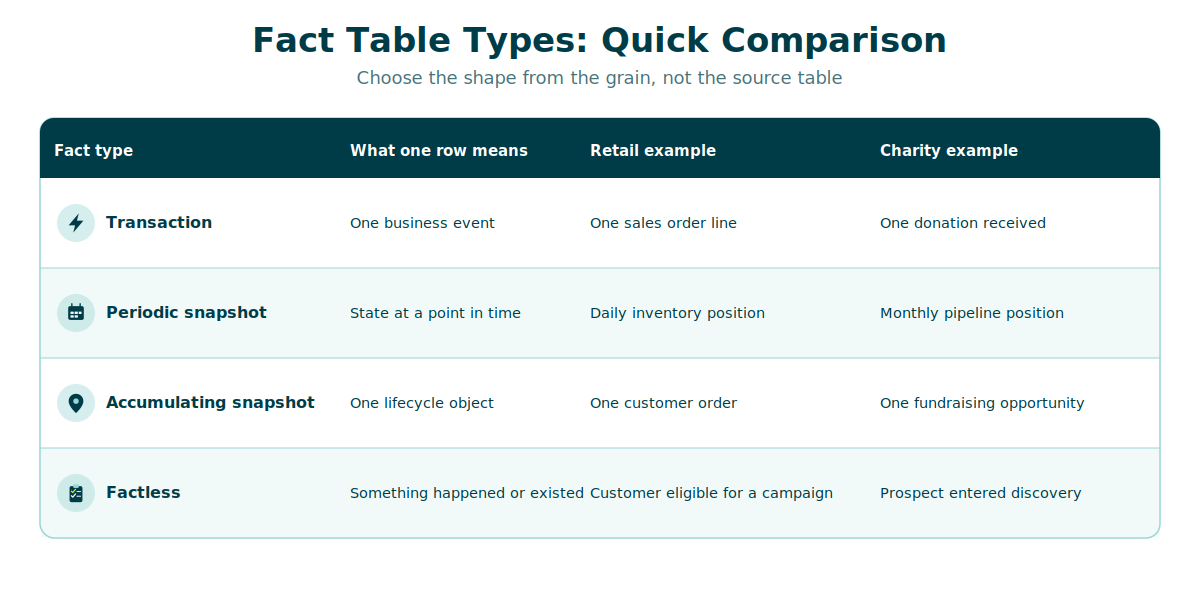
- Transaction facts record what happened, one row per event.
- Periodic snapshots freeze the state at a regular point in time, one row per period.
- Accumulating snapshots track one object through its lifecycle, one row updated as it moves.
- Factless facts record that something happened or existed with no amount to store, measured by counting rows.
- At Metis BI we see data modelling as a business exercise, not a technical one.
Transaction fact tables
This is the most common fact table (at leas tin our experience) and the one most people already picture when they hear the term. It records a business event or transaction. One row per event, captured at the moment it happens. I like to explain it like this sometimes using a retail example, imagine the ring sound at a counter at a retail store when at the till, that's the moment. Each event is recorded as its own row, so a transaction fact is usually insert-only. Existing rows are not edited and even a late-arriving event is added as a new row rather than a change to an old one.
Grain: one row per business event.
The clearest example is a retail sales table, one row per sales order line, tying a product, a store, a customer and a date to the quantity and value sold. A customer buying three different items in one basket creates three rows. The same shape fits any discrete event. A charity fundraising team might record one row per donation received. A sales team might record one row per opportunity, per stage change, capturing each time a deal moves forward, slips back or skips a stage entirely.
Reach for a transaction fact when the question is any of: what happened, when did it happen, who did it, how many times did it happen, what changed or how long passed between events. It is the right shape for activity, movement history, counts, stage changes, skipped stages, repeated actions and anything that needs an audit trail. If you need to answer how something got from A to C, whether it passed through B, skipped it or moved backwards, a transaction-grain fact is usually the right shape, because the movement itself is what you are measuring.
Periodic snapshot fact tables
A periodic snapshot records where things stood at a fixed, repeating moment. Month end, week end, close of business.
Grain: one row per period, per thing being measured.
The classic example is a retail inventory snapshot, one row per date, per store, per product, holding the stock on hand and its value at close, loaded every day whether or not that product moved. A charity fundraising equivalent is a monthly pipeline snapshot: one row per month end, per team, per stage, holding the pipeline value, the weighted value and the opportunity count as they stood on that date. That is the kind of table that sits behind most retail stock dashboards.
A common pattern is that each relevant entity gets a row in every period, even when nothing happened and this is important so will repeat... even when nothing happened. A product with no movement still appears, which is exactly what lets a periodic snapshot show a flat month or an empty shelf. A transaction fact cannot show that, because with no event there is no row. This also makes the periodic snapshot a sensible alternative when the underlying volume is enormous but the question is only about the end-of-period position.
Use it when the question is about the position at a point in time. What did the number look like at month end, what did we report at the time, what needs to stay frozen, how has the position moved across periods. It is the natural home for month-end reporting, frozen financial figures, pipeline and stock snapshots and any "as reported" view.
Here is a common thing many miss. If a number has to stay fixed after close, freeze it in a stored snapshot row. Do not rely on a report to reproduce it later from live data, because live data keeps moving and the report will quietly disagree with the board pack you issued three months ago. Also, a common misconception is that Incremental Refresh in Power BI solves this, so you do not need to think about the data and ETL upstream. That is not true! Incremental Refresh leaves historical partitions untouched, which looks like a freeze, but a full refresh reloads every partition from the live source and you will need to run one at some point. When you do, that apparent snapshot is gone.
Also, it's important to periodic snapshot measures, especially balances like stock on hand or pipeline value, are semi-additive. A month-end pipeline value or a stock balance can be summed across teams, stores or products, but it cannot be summed across time. Add twelve month-end stock balances together and you get a number that means nothing. Handle that in the model deliberately, rather than hoping nobody tries.
Accumulating snapshot fact tables
Where a transaction fact records each step as its own row, the accumulating snapshot keeps one row per object and updates it in place as that object moves through a known sequence of milestones. It suits a predictable process with a clear beginning and end.
Grain: one row per business object.
A retail order lifecycle fact holds one row per order, with columns for the order date, picked date, shipped date, delivered date and returned date, each filling in as the order reaches that milestone, alongside the current status. The charity equivalent is an opportunity fact: one row per opportunity, with the created date, ask date, gift agreed date and closed date, plus the current stage and value.
Because the row is updated as the process moves, rather than creating a new row for every step, these tables stay comparatively small and the milestone dates sitting together in one row make durations easy to measure: the time from ask to gift agreed or from order to delivery. That is usually the whole point of the shape.
It is built for lifecycle questions. Where is this now, which milestones has it passed, when did it reach each one, has it closed or completed or been returned. It gives you a clean current-status view without a separate query to reconstruct it.
A word of caution though. The accumulating snapshot is clean only while the process is clean. The moment you have repeated movements, stages skipped, objects moving backwards or a long tail of nullable date columns, the single-row model starts to fight you. Use it for a tidy lifecycle summary. When you need the full movement history, that is a job for the transaction fact and the two happily coexist in the same model.
Factless fact tables
We come to the final type for this blog. Here is the thing, not every process comes with an obvious amount. Sometimes the fact is simply that something occurred or that a relationship existed. That is a factless fact: it has no measure columns, so you measure it by counting rows.
Grain: one row per event or relationship.
The classic example I always use, a student enrolling on a course is the example that has stuck with me since early in my career. So, one row per student, per course, per enrolment. There is no amount to store. The fact is simply that the enrolment exists and you measure it by counting rows. The same shape covers a retail campaign eligibility fact. So, one row per customer, per campaign, per eligibility date, recording that a customer qualified for a promotion whether or not they went on to buy anything.
Reach for a factless fact when the question is did this happen, was this entity in this state, how many students enrolled on a course, how many customers were eligible, how many qualified but never acted. It is the right shape for counts, eligibility, coverage, and absence analysis. That last one earns its place more often than people expect, because a factless fact lets you count what should have happened and did not. A value-based fact cannot, since there is no row for the missing thing to sit in.
Quick comparison
A simple way to decide
Let the question guide you:
- If the question is "what happened?" use a transaction fact.
- If the question is "what did the number look like at month end?" use a periodic snapshot.
- If the question is "where is this thing now?" use an accumulating snapshot.
- If the question is "did this happen, even without an amount?" use a factless fact.
Start with the sentence, not the table
Notice what did not decide any of this... the source system. I get asked to model straight from whatever tables the source hands over and it is the wrong starting point every time. Source tables tell you what data exists. They do not tell you what the business is trying to measure or what question the report needs to answer.
Choose the fact table shape from three things, in this order: the business process, the question being asked and the grain of the row. The grain is the one that ties it together, because it is where the process and the question meet. Everything downstream inherits whatever you decide here. Fact table design is not a technical exercise, it becomes the spine of your semantic model and a model built on the wrong grain is hard to fix once reports depend on it.
So before you open a modelling tool, finish this sentence: one row represents... A good model does not start with tables. It starts with the sentence that defines the row. Also, highly recommend having a look at the book: Agile Data Warehouse Design by Jim Stagnitto and Lawrence Corr for the BEAM methodology.
Where this fits with Metis BI
Getting the fact tables right is one of the most important things you can do for any data solution and I say the same thing to every client: this is a business exercise, not a technical one. Before anyone opens a tool, get into the tech, we talk through the business process, identify the business events that matter and design a fact table around each one. One fact per business process is the principle at the heart of Lawrence Corr's Agile Data Warehouse Design, and once you have had that conversation properly, the grain, the relationships and the measures tend to fall into place.
Dimensional modelling looks simple on a slide and gets political in practice. The shape you choose decides which questions the business can ask, how the numbers behave at month end, and how much rework lands on you a year later when someone asks a question the grain cannot answer. Most of the models I am brought in to fix were built with little thought into the process, and the cost of that shows up slowly.
This is what Metis BI does at its core. We design the model around the questions the business actually needs answered, agree the grain before anyone builds, and keep the result governed so it holds up as the estate grows. It is foundation work, and it suits teams who have outgrown a first Power BI build and need the model to carry more weight. Learn more about how we approach Power BI report and model development.


.png)
.png)
.png)