

Donor Concentration
Risk, built for Action.
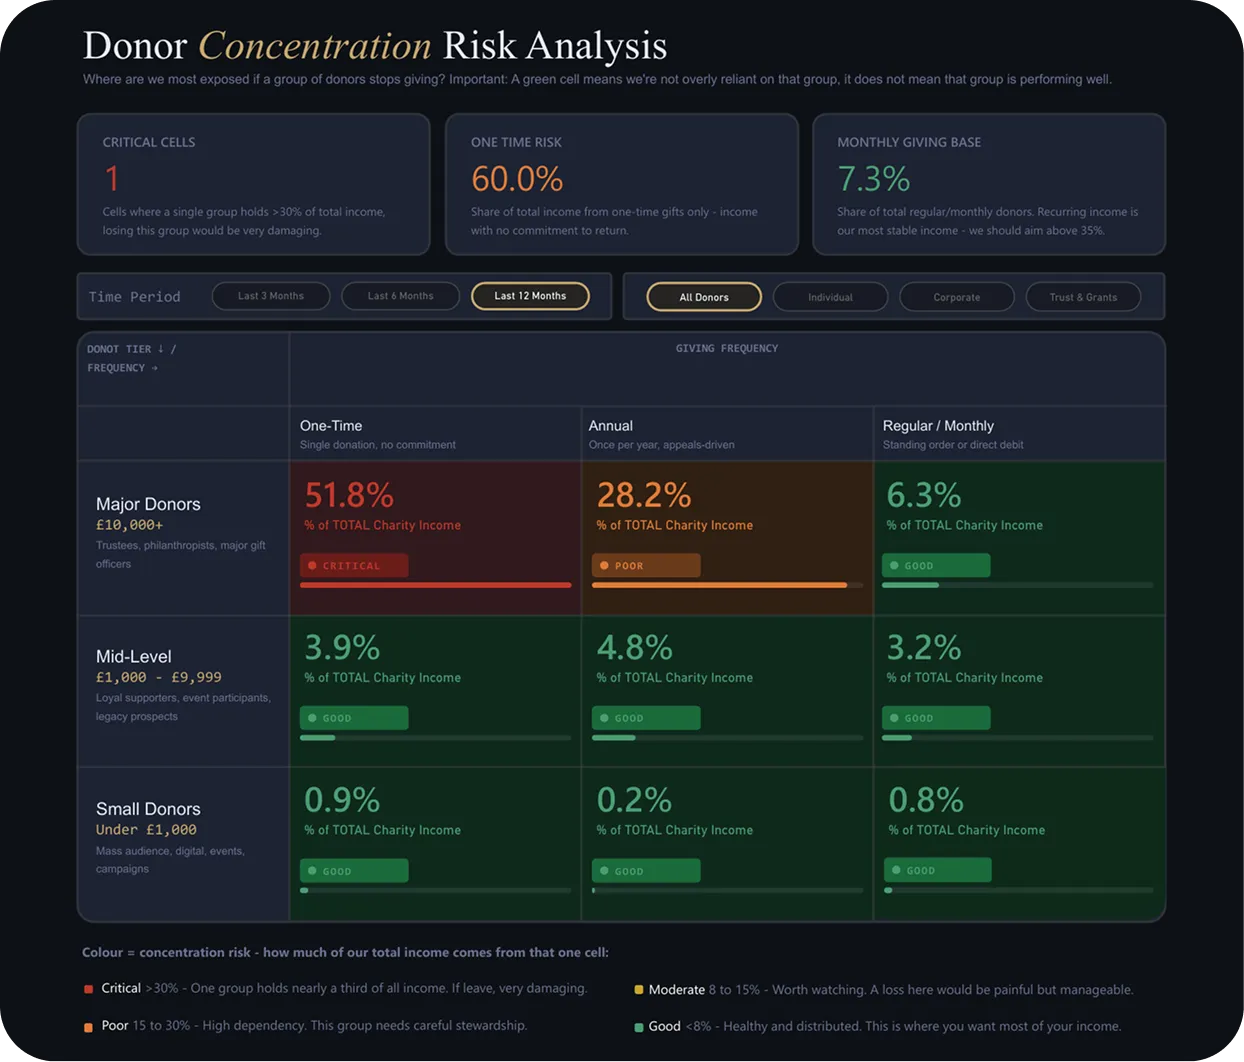
Your income total looks fine. But which donor groups is your budget actually depending on? And what happens when they don't renew? This is the view that answers those questions on one screen, in plain English.
- See which cells in your income matrix carry dangerous dependency
- Know your one-time income risk and how exposed you really are
- Find out how small your monthly giving base actually is
- Give your trustees three numbers they can act on, not a spreadsheet

See your income risk.
In one screen.
Metis BI uses a proven storytelling methodology to build reporting that your board can actually act on. We start with the governance question, define what good looks like in plain English, and build around decisions — not visuals. This is what that looks like in practice.
- One-time major donor gifts representing 51.8% of total income — rated Critical
- A single donor relationship carrying 19% of all income, with no standing order
- A monthly giving base of just 7.3% — far below what sustains a resilient plan
- Toggle time periods to track how dependency evolves across the year
Of total income from Major Donor one-time gifts — rated Critical
8 donors · Average gift £41,028
Of total income from Major Donor one-time gifts — rated Critical
No standing order. No direct debit. No guarantee.
Of total income from Major Donor one-time gifts — rated Critical
Most boards are surprised how low this is

For UK charities, harnessing data and Power BI is critical to building financial resilience and demonstrating impact.
- Income & Donor Dependency Analysis Understand exactly where your income comes from, which donor groups you are over-reliant on, and what your exposure looks like if a key relationship changes. Concentration risk, one-time income %, and your regular giving base — all in one governed view your trustees can act on.
- Fundraising Performance & Pipeline Track campaign ROI, major donor pipeline health, acquisition cost, and retention rates across giving channels. Turn your CRM data — Salesforce, Raiser's Edge, Donorfy — into a single, refreshable view that tells your fundraising team exactly where to focus next.
- Financial Health & Reserves Reporting Give your finance committee a real-time view of income versus budget, restricted versus unrestricted funds, and reserves against policy. Built for non-technical trustees — no spreadsheet exports, no manual updates, just clean governed reporting that refreshes automatically.
- Impact & Programme Reporting Demonstrate outcomes to funders and your board with clear, evidence-based reporting. Connect programme delivery data to income sources, show what restricted funds achieved, and produce the kind of impact narrative that supports both grant renewal and public trust.
Trusted by UK organisations.
Rated 5.0 on Clutch.
Proven Approach
You Work With the Expert
One Call Changes the Conversation
Board & Trustee Reporting
Give trustees, boards, and leadership teams a clearer view of performance, donor dependency, financial trends, and operational risk. We design reporting that helps non-technical decision-makers understand what matters quickly.
Fundraising, Finance & CRM Integration
Most charities already have the data they need, but it is spread across systems. We bring together CRM, finance, and spreadsheet data from platforms such as Raiser's Edge, Donorfy, Xero, Sage, and Salesforce into a more reliable reporting layer.
Donor Risk, Income Dependency & Performance
Totals alone are not enough. We help charities understand donor concentration risk, income dependency, campaign performance, fundraising trends, and where attention is needed before issues become bigger problems.
Governance, Security & GDPR
Donor and financial data is sensitive. Our solutions are designed with governance, access control, security, and GDPR in mind, so reporting is not just useful, but also safe, controlled, and fit for regulated environments.
We've worked with charities. We understand the constraints.
Charities work under real pressure: limited internal capacity, sensitive donor and financial data, and trustees who need a clear view of risk, dependency, and performance. Metis BI builds Power BI and Microsoft Fabric solutions that improve board reporting, fundraising visibility, and finance insight, without forcing teams to replace the systems they already use.

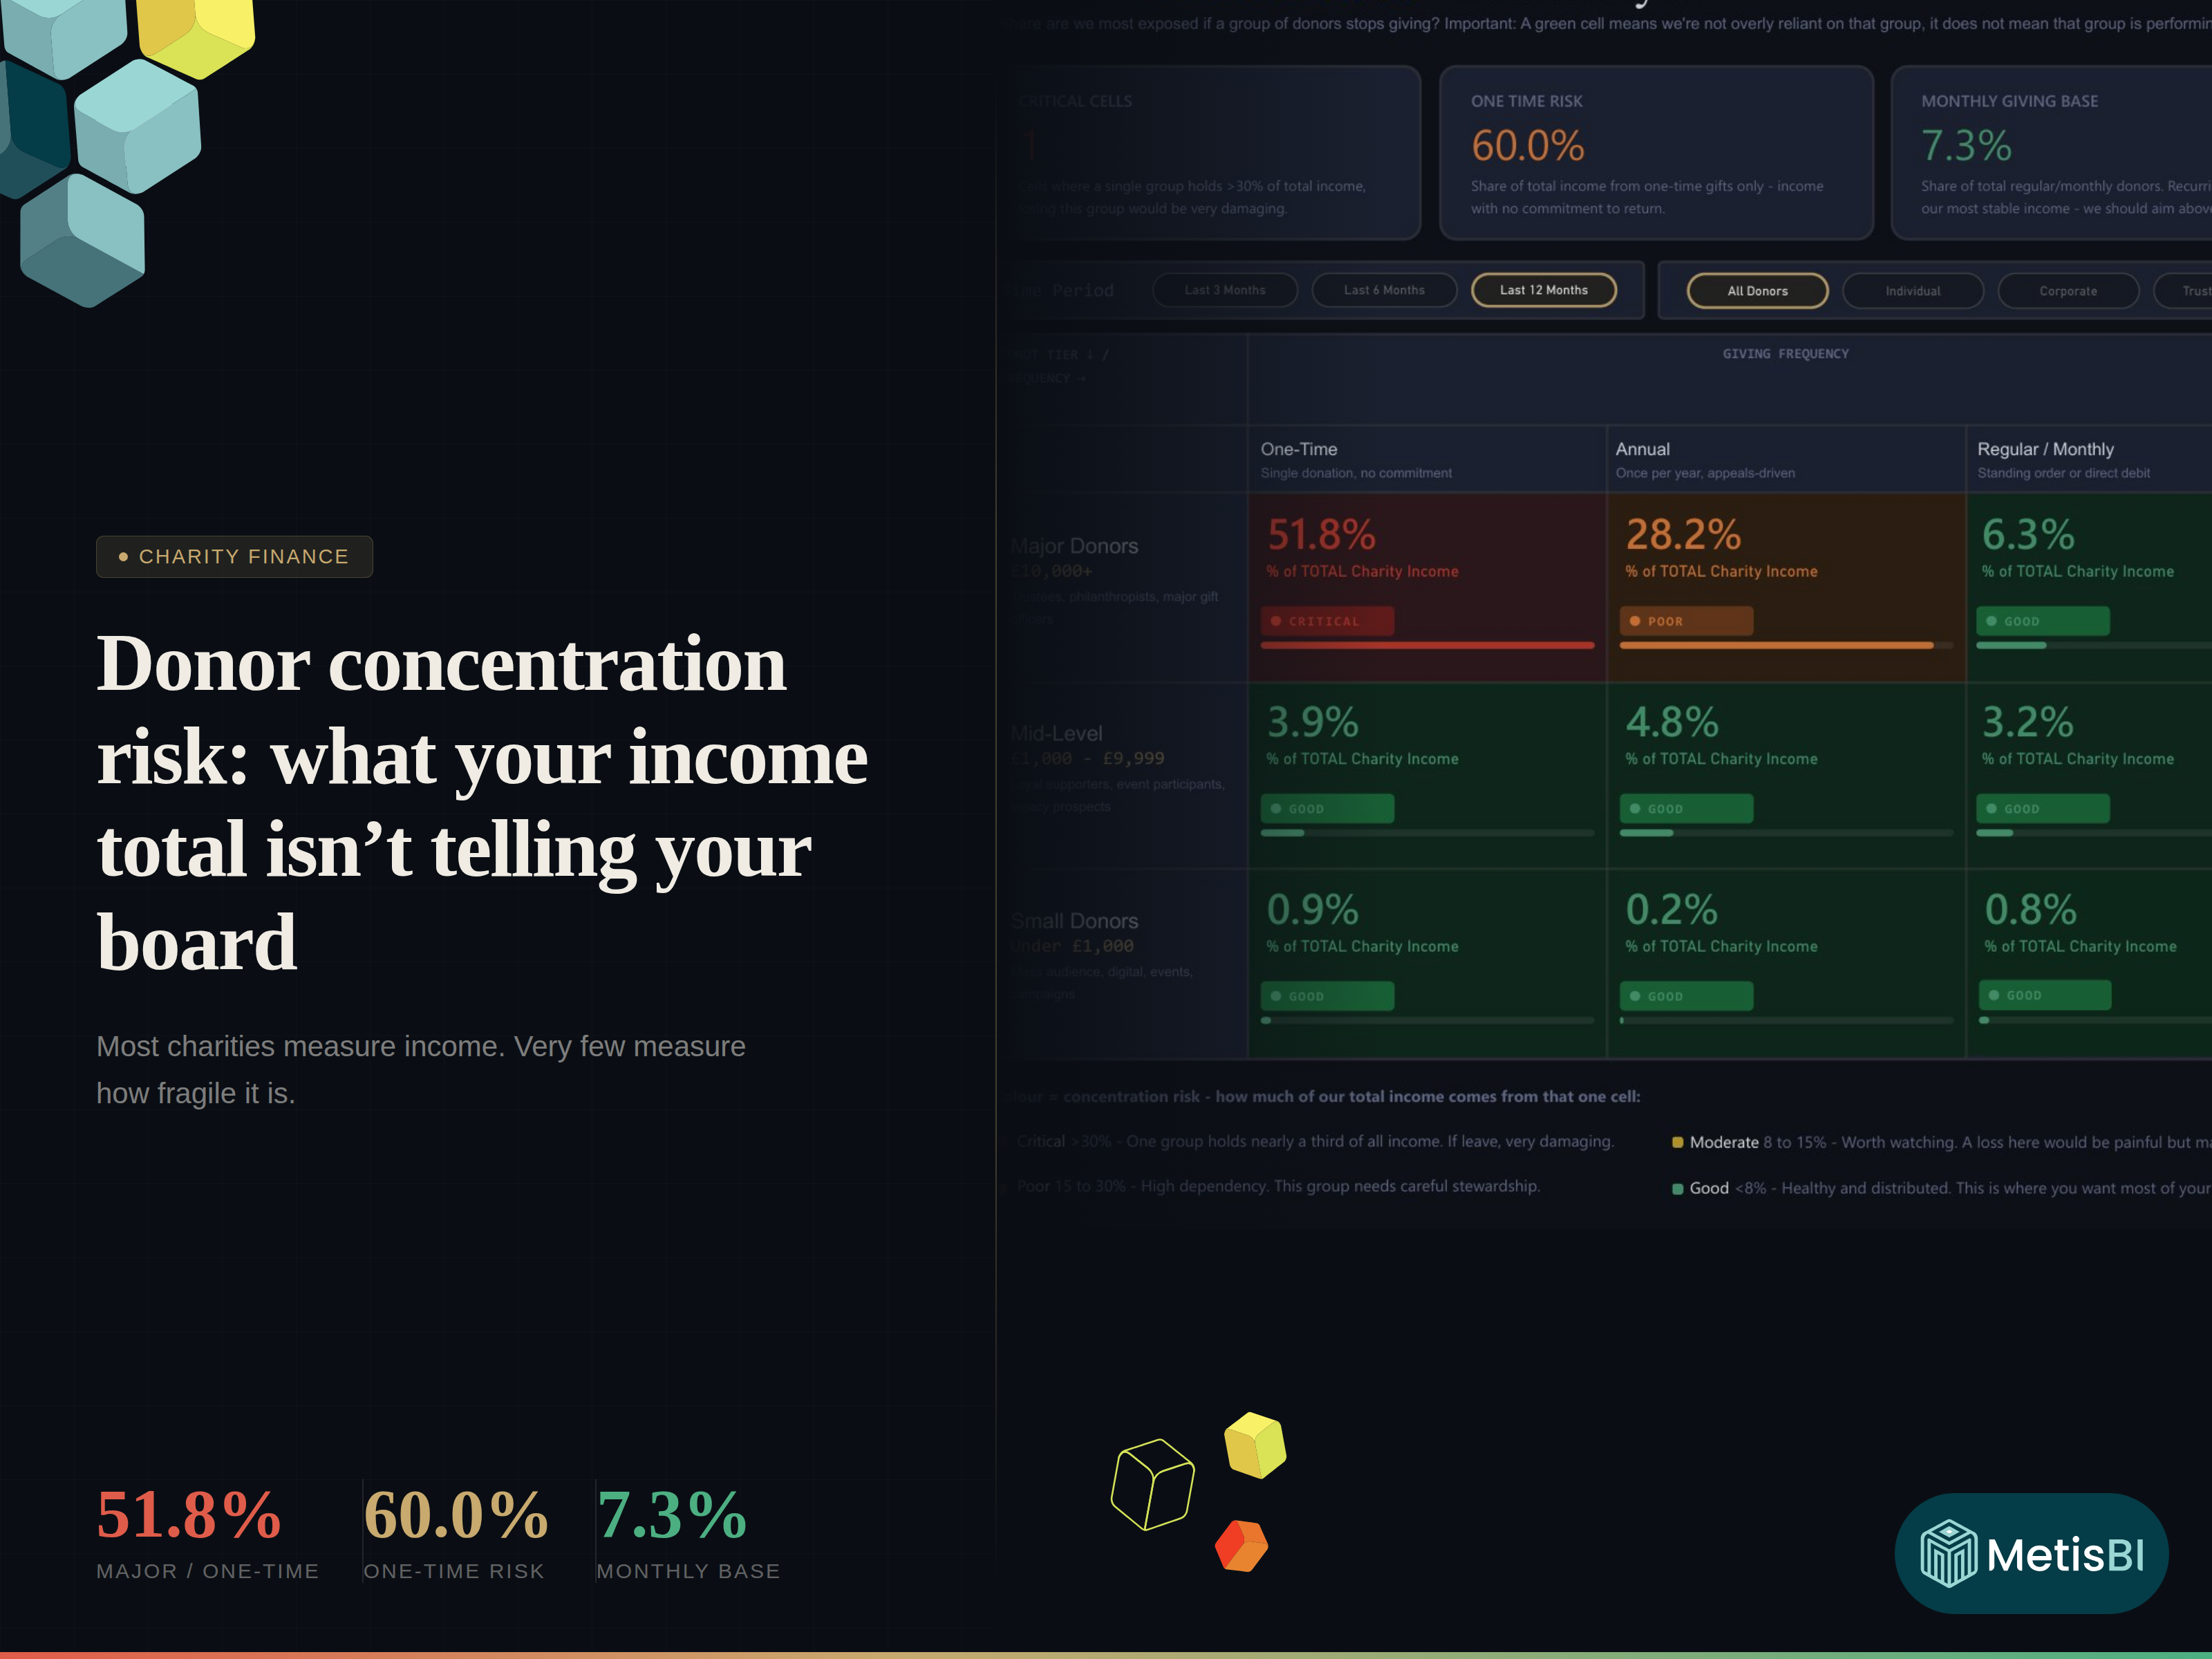
Donor Concentration Risk: What your income total isn't telling your board
Read the articleClients We Have Loved Working With


The answers to your questions.
Power BI gives trustees and boards a clear, consistent view of the metrics that matter — income by source, reserves, programme performance, and financial health — without relying on spreadsheets or manual updates before every meeting. A well-built reporting layer pulls from your finance system, CRM, and data exports into a single dashboard that refreshes automatically. Boards get one version of the truth. Finance teams spend less time compiling packs.
Yes. This is one of the most valuable things Power BI can do for a charity. We build concentration risk matrices that classify your income by donor, channel, and giving behaviour — showing exactly where your budget depends on a small number of relationships. If a single major donor or grant represents a disproportionate share of your income, your board needs to see that. Our solutions surface income dependency clearly, so it becomes a board-level conversation rather than a finance team concern.
A charity board dashboard should include total income vs target, income by source, donor concentration risk, reserves and financial health indicators, fundraising pipeline performance, and key programme or impact metrics. Trustees need to see risk exposure at a glance — not a spreadsheet with forty tabs. We design dashboards that are built for board-level decision-making, with the right level of detail and no unnecessary noise.
Power BI can connect to a wide range of charity data sources including fundraising CRMs, finance systems, grant management tools, and spreadsheets. Common combinations we build for charities include Raiser's Edge or Donorfy alongside Xero or Sage for finance, with additional sources from Salesforce or Excel. The goal is a single reporting layer that sits across your existing systems — so you get consolidated insight without having to replace the tools your teams already use.
Yes. We regularly build charity reporting solutions that connect multiple data sources — including Raiser's Edge, Donorfy, Xero, Sage, Salesforce, and Excel exports — into a unified Power BI environment. Each source has its own connector or extraction approach, and we handle the data modelling to make everything work together cleanly. The result is one reporting layer where fundraising, finance, and CRM data sit alongside each other, without any manual consolidation.
Data governance and GDPR compliance are built into every solution we deliver for charities. That means row-level security to control who sees which data, workspace access control to restrict report distribution, and careful handling of personally identifiable donor information throughout the build. We do not treat security as an afterthought. For charities handling sensitive donor relationships and financial data, access control and GDPR alignment are part of the brief from day one.
Yes — and this is how most of our charity engagements work. We build a reporting layer on top of your existing systems rather than replacing them. Your fundraising team keeps using Raiser's Edge or Donorfy. Your finance team stays on Xero or Sage. Power BI connects to those systems and brings the data together. You get better reporting, clearer board dashboards, and visibility across the organisation — without the cost or disruption of a system migration.
For most charities, Power BI is the right starting point. It handles reporting, dashboards, and data integration well, and it is proportionate to the typical data volumes and budgets in the sector. Microsoft Fabric becomes relevant when a charity has more complex data engineering needs — for example, large-scale grant reporting, multiple integrated data pipelines, or a desire to build a central data platform across the organisation. We will always recommend the right tool for your situation, not the most complex one.
Let's Talk Power BI!
