Top Performer Coverage, built for Inbound Teams.
Your conversion totals look fine. But which shifts and days are your best people actually covering? And what is that costing you when they are not there? This is the view that answers those questions on one screen, in plain English.
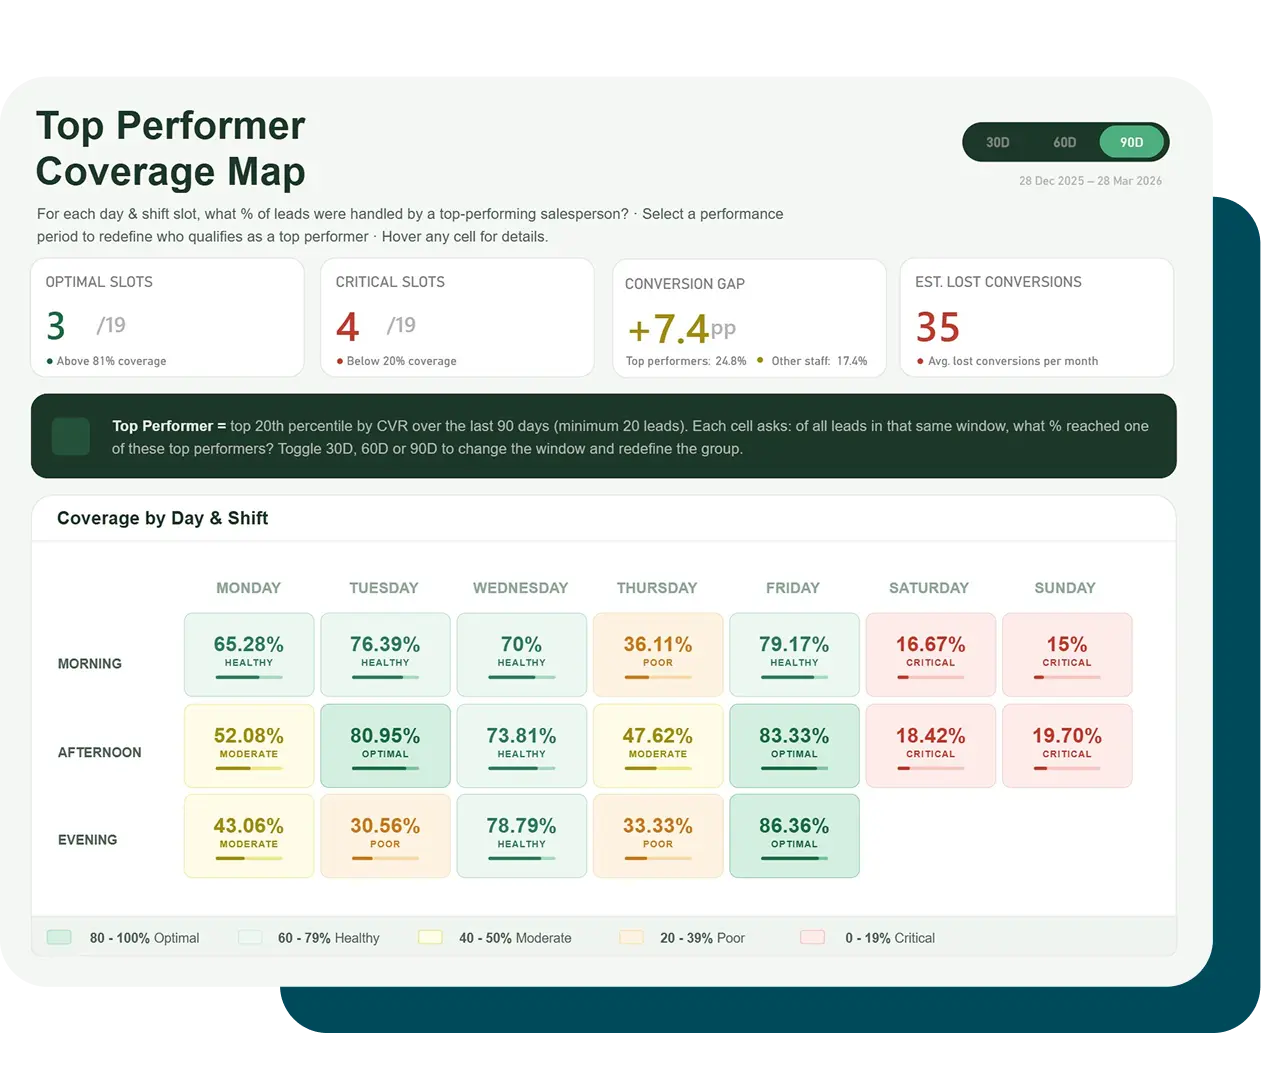
- Spot which day and shift slots have critical coverage gaps
- See the conversion gap between top performers and other staff
- Quantify estimated lost conversions per month by slot
- Toggle 30, 60 or 90 days to redefine the top performer group


See your coverage gaps. In one screen.
Metis BI uses a proven storytelling methodology to build reporting that operations and sales leaders can actually act on. We start with the scheduling question, define what good coverage looks like, and build around decisions — not visuals. This is what that looks like in practice.
- Saturday and Sunday morning slots rated Critical — below 20% top performer coverage
- A 7.4 percentage point conversion gap between top performers and other staff
- 35 estimated lost conversions per month from under-covered slots
- Toggle 30D, 60D or 90D to dynamically redefine who qualifies as a top performer
Critical slots with top performer coverage below 20%
Saturday and Sunday across morning and afternoon shifts
Conversion gap between top performers and other staff
24.8% vs 17.4% — a measurable commercial difference
Estimated lost conversions per month from under-covered slots
Based on the 90-day rolling performance window

For financial services and inbound sales teams, knowing who converts is only half the picture. Knowing when your best people are missing is where the real value sits.

Top Performer Coverage by Day and Shift
For each combination of day and shift, this dashboard shows what percentage of leads were handled by a defined top performer. Coverage is rated Optimal, Healthy, Moderate, Poor or Critical — giving operations teams an immediate visual of where risk sits across the week.
Insurance and Lending Sales Analytics
Conversion rate reporting for insurance quote teams and lending enquiry handlers often masks the shift-level patterns that drive real performance. We build Power BI solutions that surface where your best people are, when they are there, and what it costs when they are not.
Contact Centre and Inbound Operations
Inbound contact centre teams sit on a wealth of operational data — agent performance, lead volumes, conversion outcomes — that rarely gets connected. We build governed reporting layers that bring those sources together and give operations leaders a clear, actionable view across the week.
CRM, Dialler and Data Integration
Most financial services teams already have the data they need. It just sits across a CRM, a dialler platform, and a set of spreadsheets. We connect those sources into a single Power BI environment — no system replacement, no complex migration, just cleaner reporting built on what you already use.
Trusted by UK organisations.
Rated 5.0 on Clutch.
Proven Approach
You Work With the Expert
One Call Changes the Conversation
We have worked with inbound and sales operations teams. We understand where the real performance gaps hide.
Financial services and inbound sales teams face a specific problem: aggregate conversion reporting hides the scheduling patterns that actually drive performance. Metis BI builds Power BI solutions that surface top performer coverage gaps, quantify the commercial impact, and give operations leaders something they can act on — without replacing the systems they already use.

Inbound Sales and Contact Centre Reporting
Give operations leaders and sales managers a clear view of top performer presence, slot-level coverage, and conversion performance across the week. Built for decision-makers who need to act on scheduling — not just review league tables after the fact.
CRM and Dialler Data Integration
Most inbound teams already have the data they need, but it sits across CRMs, dialler platforms, and spreadsheets. We bring together lead, outcome, and agent data into a single governed reporting layer — refreshable, auditable, and designed for operational decisions.
Coverage Gap and Lost Conversion Quantification
Knowing who your top performers are is not enough. We help teams understand where those people are absent from high-value inbound slots, what the conversion delta looks like at shift level, and what that is likely costing the business each month.
Governance, Row-Level Security and Access Control
Sales and agent performance data is sensitive. Our solutions are built with role-level access control and governance from day one — so the right people see the right data, and the reporting is fit for regulated environments and internal audit.
.png)
Top Performer Coverage Dashboard Power BI: When Your Best People Are Missing From the Slots That Matter
Read the articleClients We Have Loved Working With


The answers to your questions.
Power BI helps inbound teams move beyond daily conversion averages to see performance at shift and agent level. When you can see which slots have low top performer coverage, what the conversion gap looks like at that level, and what it may be costing you each month, scheduling decisions stop being based on preference and start being based on data.
Most inbound teams only see aggregate conversion numbers. Those averages hide the fact that performance varies significantly by day, shift, and which agents are on the floor. When high-value slots are under-covered by your best people, that gap translates directly into missed conversions — and it usually goes unnoticed until someone builds the right reporting.
Yes. We build a reporting layer on top of your existing systems. Your team keeps using the CRM and dialler they already use — we connect to those sources, model the data in Power BI, and build the reporting layer on top. No system replacement, no migration project.
In this solution, a top performer is defined as an agent in the top 20th percentile by conversion rate over a rolling window — typically 30, 60 or 90 days — with a minimum lead volume to ensure the result is statistically meaningful. The window is adjustable, so the definition updates dynamically as performance changes.
Engagements vary depending on data availability, source complexity, and scope. A focused build — one data source, clear requirements, a single governed dashboard — typically runs between 5 and 15 days. Metis BI always starts with a data and requirements review before committing to a build plan or timeline.
Some clients have an in-house analyst or BI developer; others do not. We work with both. Where there is no internal capability, we handle the data modelling, DAX, and report build end to end. Where a team wants to own and extend the solution after delivery, we build with that in mind and provide handover documentation and optional training to upskill them.
We work with inbound sales operations, contact centres, insurance quote teams, lending enquiry handlers, and financial services businesses where conversion performance and scheduling decisions carry direct commercial value. If your team handles inbound leads and conversion rates matter, this type of reporting is likely relevant.
A focused engagement typically runs between 5 and 15 days from data review to final delivery. Larger projects with multiple data sources or more complex requirements take longer. We scope every engagement individually after reviewing your data — we do not commit to a timeline before we understand what we are working with.
Let's Talk Power BI!
