

Power BI Health Check and Audit for Your BI Environment
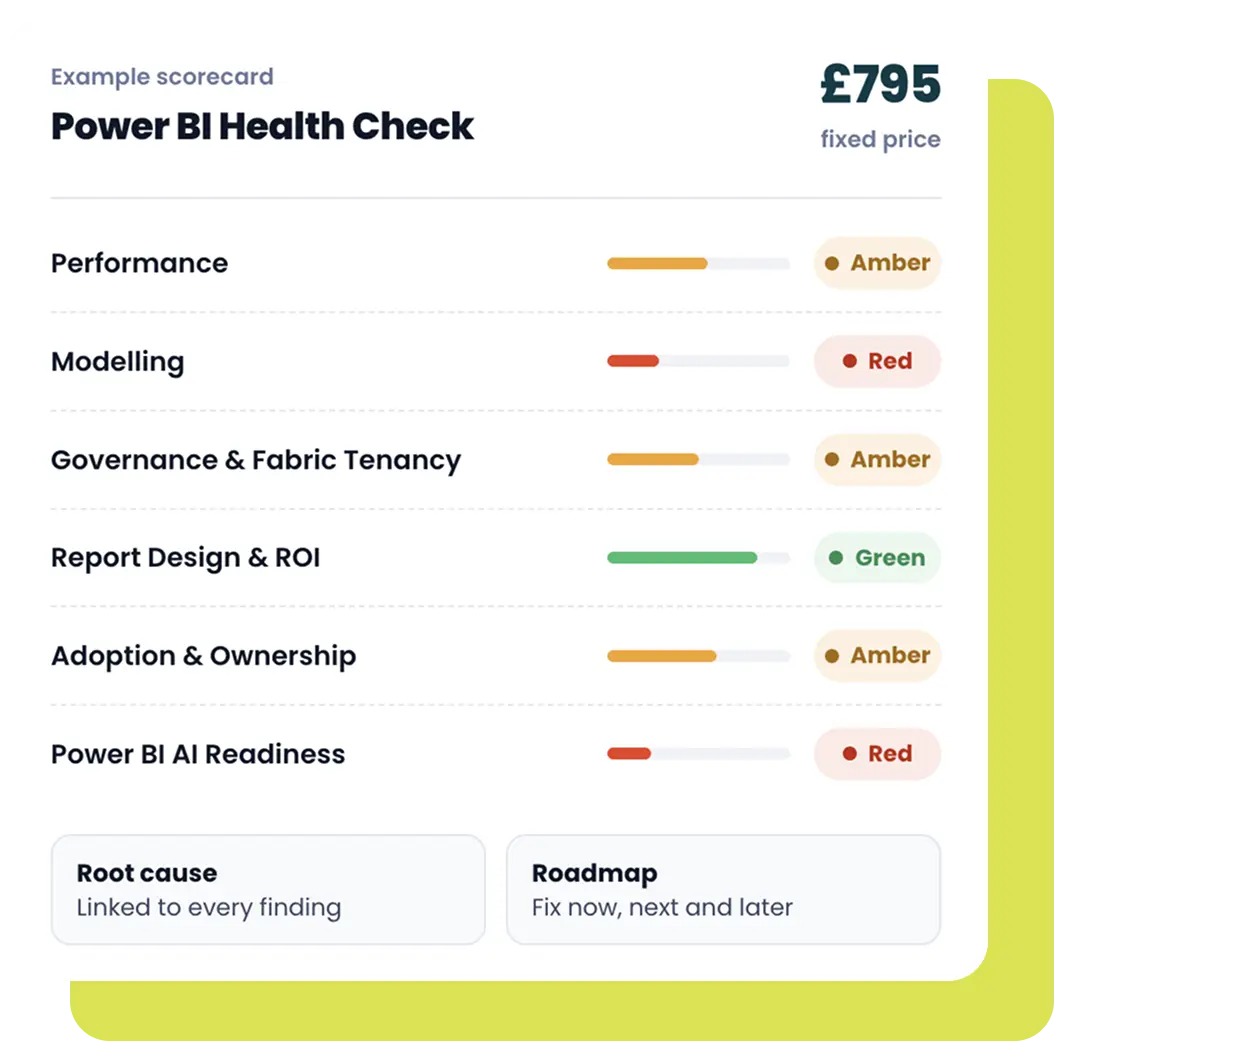
A fixed-price, senior-led assessment of your reports, models and wider BI environment. In two days we inspect six areas, score each one Red, Amber or Green, and hand you a clear pack of findings and a roadmap showing what to fix first.
- £795 fixed price, credited against follow-on work booked within 60 days
- Your recommendations pack within 5 working days of access
- Six areas scored against 60+ questions
- Led by Laz, ex-Head of Power BI & Analytics, Telefónica Tech (Adatis)


Fixed price
One price, agreed scope, no surprises.
Areas scored
Red, Amber or Green, so you see where you stand at a glance.
Questions
Refined over 10+ years of solving real client challenges.
Senior consultant time
Hands-on inspection, then bespoke advice.

What is a Power BI health check?
A Power BI health check is a structured assessment of the condition of your setup, from the data sources and semantic models through to the reports people open every day. At Metis BI it is a fixed-price, two-day engagement at £795. We work through 60+ questions across six areas, score each area Red, Amber or Green, and deliver a recommendations pack (PDF) with a prioritised roadmap within five working days of access.
Some teams call it a Power BI audit, others an assessment. The aim is the same, an honest picture of what is working, what is at risk and what to fix first.
Discuss My ProjectTrusted by UK organisations to get more from their data and analytics
Verified feedback and recognition from our clients.


"Metis BI's professional approach, great knowledge, and overall support during the project were impressive."
"They met every deadline, were proactive, and maintained complete transparency throughout the whole project."
"Their work combined focus on delivering a reporting solution with upskilling team members."
“Thanks to Metis BI's work, we're now fully able to move our business forward. All of our data flows have improved.”










Top Power BI & Data Solutions Company UK 2026
Top Data Visualisation Company UK 2026
Signs your BI environment needs a health check
Setups rarely break in one dramatic moment. They drift. A report slows down, a number gets questioned, a developer leaves, and before long the team is firefighting more than it is improving. These are the signals we hear most often.

Reports are slow
Pages crawl, visuals time out and refresh failures land in someone's inbox every morning.

You have inherited an estate
A developer, contractor or partner has moved on, and nobody is sure how it was built or who owns what.

Security and sharing feel unclear
You cannot say with confidence who can see what, or whether you would be audit-ready if asked.

A Microsoft Fabric migration is coming
You want to know what you would be moving before you move it.

Users do not trust the numbers
Two reports show two different figures for the same measure, and people drift back to Excel.

Small changes break things
The model has become fragile, so one edit causes new errors somewhere else.

You are about to scale
More users, more departments or a wider self-service rollout is planned.

Leadership is asking about Copilot
You need to know whether AI would give accurate answers on top of what you have.
If two or three of these sound familiar, a health check is usually the quickest way to find out why. Prefer to start on your own? Try our free Power BI checklist, or read more about the warning signs and when an assessment is worth it.
What the Power BI audit covers
Every engagement inspects the same six areas, using 60+ questions refined over Laz's 10+ years of helping organisations with their Power BI challenges.

Performance

Modelling

Governance & Fabric Tenancy

Report Design & ROI

Adoption & Ownership

Power BI AI Readiness
For a deeper dive, see our Copilot-ready data model service.
How each area is scored:
Green
Sound. Keep doing what you are doing.
Amber
At risk. Worth planning a fix before it grows.
Red
Critical. Fix first, it is already costing you time, credibility or money.
Every problem traced back to its root cause
Most of what goes wrong looks technical. Slow visuals, clumsy Power Query and weak DAX are real, but they are usually symptoms. The root cause tends to sit further back, in no standard way of gathering requirements, no agreed approach to modelling, no clear ownership or no change process.
So every finding in your pack is linked to the cause behind it. Fix the symptom and it tends to come back. Fix the cause and it tends to stay fixed.
What you see
Slow visuals
Clumsy Power Query
Weak DAX

What sits behind it
No standard way of gathering requirements
No agreed approach to modelling
No clear ownership
No change process
A real example
Bigger SKU, job done?
One client came to us with slowdowns in their Microsoft Fabric capacity. On the surface it looked like a sizing question, bigger SKU, job done. Once we assessed it properly, the picture was very different. Workloads were not isolated sensibly, heavy operations collided at predictable times, a handful of reports did far more work than they needed to, and control over who could deploy into the capacity had drifted. A bigger capacity would have masked all of that for a while and quietly cost them more every month.
How the health check works
Two days of senior consultant time and three calls, with your pack delivered within five working days of access.
Step 1
Kick-off call
We agree scope, confirm what is in and out, and set up read-only access.
Step 2
Current state assessment call
Your team walks us through the setup, the pain points and what the business needs from it.
Step 3
Deep-dive inspection
Hands-on inspection of your models, reports, refresh history, security, tenant settings and usage data, covering all 60+ questions.
Step 4
Bespoke recommendations
We score each area, map findings to root causes and write your pack and roadmap.
Step 5
Playback call
We walk you through the findings, answer questions and agree what to fix first.
Everything is delivered remotely. We only ever look, and nothing in your tenant is changed.
Agreed at the kick-off call. Larger estates are prioritised by impact, or quoted separately before we start.
Scope
Scoped around the reports that matter most
Scope is agreed before we start, and it can span business areas, reports and models. We have seen single reports with 20+ pages and models with 100+ tables, so it is only right that we scope properly and agree which solutions are in.
A typical scope covers one business area, up to five reports and two models. If your estate is bigger, we help you prioritise based on impact and business priority, so the two days go where they matter most.
What you receive
Your recommendations pack and roadmap
- Recommendations pack (PDF): detailed, easy to follow and written for technical and business readers alike.
- Red, Amber, Green scorecard: a one-page view of all six areas, ready to share with leadership.
- Root-cause findings: each issue linked to the standard or governance gap behind it.
- Actionable roadmap: actions ordered by impact and effort, split into fix now, next and later.
- Playback session: a walkthrough of the findings with your team.
Optimise first, then scale with confidence

Some teams take the findings and fix everything in-house. Others want help with the first few items. Depending on what we find, the next step might be targeted Power BI report optimisation, tightening standards through a Power BI governance engagement, rebuilding a model, or confirming your setup is largely fine with a few focused improvements.
We will tell you honestly which it is. Not every assessment should turn into a bigger project.

Fixed price, limited spots each month

Fixed price
Two days of senior consultant time, three calls, a scored pack and a prioritised plan of action.
- Each one is senior-led, so we take on a limited number every month.
Credited back in full
 £795 off
If you book follow-on work with us within 60 days, the full £795 is deducted from that engagement. So if it leads to optimisation or governance support, the assessment has effectively cost you nothing.
Senior-led, from kick-off to final playback
Every engagement is run by a senior consultant who gets hands-on with your reports and data, and writes every finding personally. That is exactly why numbers are limited each month.

Lazaros Viastikopoulos
Founder & Principal Consultant
Laz founded Metis BI after more than a decade of hands-on delivery. As Head of Power BI & Analytics at Telefónica Tech (formerly Adatis), one of the largest data and AI consultancies, he regularly ran health checks for clients. He has spoken at SQLBits, Data Relay and Power BI User Groups across the UK.
"I have run a lot of these over the years, and more often than not the pattern repeats. The slow report is rarely the real issue. It is usually two or three layers further back, in how the model was designed, who owns it and whether anyone agreed a standard in the first place. That is where I spend the two days."
Laz, Founder, Metis BI
Questions about the Power BI audit and assessment
Cannot see your question? Ask Laz directly.

A Power BI health check with Metis BI is a fixed price of £795. That covers two days of senior consultant time, a kick-off call, a current state assessment call, a playback call, and your scored pack. If you book follow-on work with us within 60 days, the £795 is deducted in full.
Two days of consultant time, one for deep-dive inspection and one for writing your bespoke advice. You receive the pack within five working days of us getting access, followed by a playback call.
An inspection of six areas (Performance, Modelling, Governance & Fabric Tenancy, Report Design & ROI, Adoption & Ownership, and Power BI AI Readiness), each scored Red, Amber or Green. You receive a PDF pack with root-cause findings, an actionable roadmap split into fix now, next and later, and three calls, including a playback. Fixes themselves are not included, although we can help with them afterwards.
A health check and an audit answer the same question. What condition is our setup in right now, and what should we fix first? We use the terms interchangeably. It is inspection-led, fixed-price and completed in two days. A Power BI governance engagement goes further, with 6 to 12+ days of current state meetings, advice on framework, architecture, licensing, rollout and change management, and a detailed roadmap for how the platform should be run going forward. Many clients start with the two-day assessment and use it to decide whether governance is the right next step.
Read-only access to the workspaces and semantic models in scope, agreed at the kick-off call. For tenant settings and activity data, your Fabric administrator can either grant temporary access or run a few short exports we talk them through. Nothing in your tenant is changed.
Yes. Everything happens over video calls, so nobody needs to be on site.
Power BI Pro, Premium Per User, Premium capacity and Microsoft Fabric capacity, including Direct Lake and other Fabric workloads sharing that capacity. The same six areas apply to all of them.
A typical scope is one business area, up to five reports and two models. Where the estate is larger, we help you choose the items with the biggest business impact. If you need wider coverage, we quote it separately before starting.
Yes, it is one of the most useful times to do one. Migrating a fragile setup moves the mess rather than solving it, and Copilot amplifies whatever state your metadata and definitions are already in. The assessment shows what to fix first.
Want an honest view of your Power BI setup?
- £795 fixed price, credited back on follow-on work
- 2 days of senior consultant time
- Your pack within 5 working days of access