


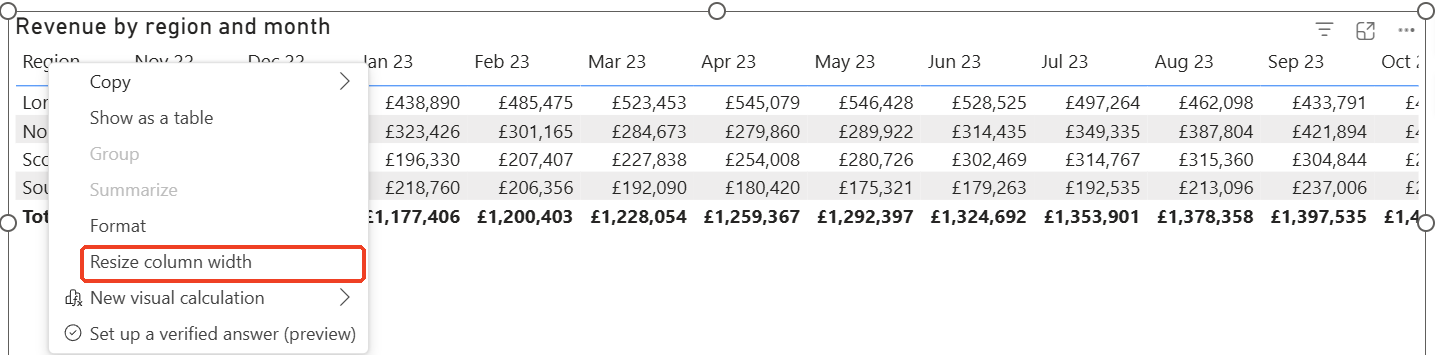
Truncated column headers are one of those small things that make a table look a bit unfinished. "Customer Segm..." or "Revenue vs Pr..." and the viewer has to hover or guess. From Microsoft's May 2026 feature summary, authors have been able to set fixed column widths in pixels in the Format pane since that update. Now, the September 2026 update made setting and resetting a width from the column header's right-click menu generally available, which Microsoft describes for report viewers. In Power BI Desktop, the right-click menu I tested had Resize column width.
In my test in Power BI Desktop, using that right-click option also switched on a Format pane setting called Custom widths. The release note does not mention this, though Microsoft's tables page does say manual resizes show up in the Custom widths settings.
Definition: in Power BI Desktop, Resize column width on the right-click menu of a table or matrix column header lets you type an exact width in pixels. In my test, using it switched on Custom widths for that visual (Format, Layout, Column width) and recorded the width there.
Key takeaways, all from my own testing:
- It switches Custom widths on for you: if it was off, Desktop turned it on and stored my width in the Format pane.
- In Desktop the menu item reads "Resize column width": not "Set column width", and there was no reset item in that menu.
- Month columns did not resize from the menu: right-clicking a single month in my matrix and resizing it had no visible effect.
- Undo it in the Format pane: switching Custom widths off put my columns back to automatic widths.
Where the right-click resize lives
In Power BI Desktop, right-click a column header in a table or matrix. In my test the menu included Resize column width.
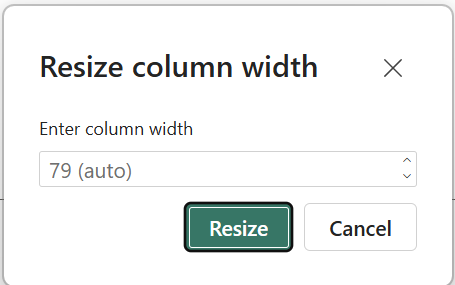
Select it and a small dialog appears, "Enter column width", with the current width already in the box, for example "79 (auto)", and units in pixels. Select everything in the box, type your number and select Resize. In my first test I typed without clearing the box first and the resize didn't apply, so clear it before typing.
What happens in the Format pane
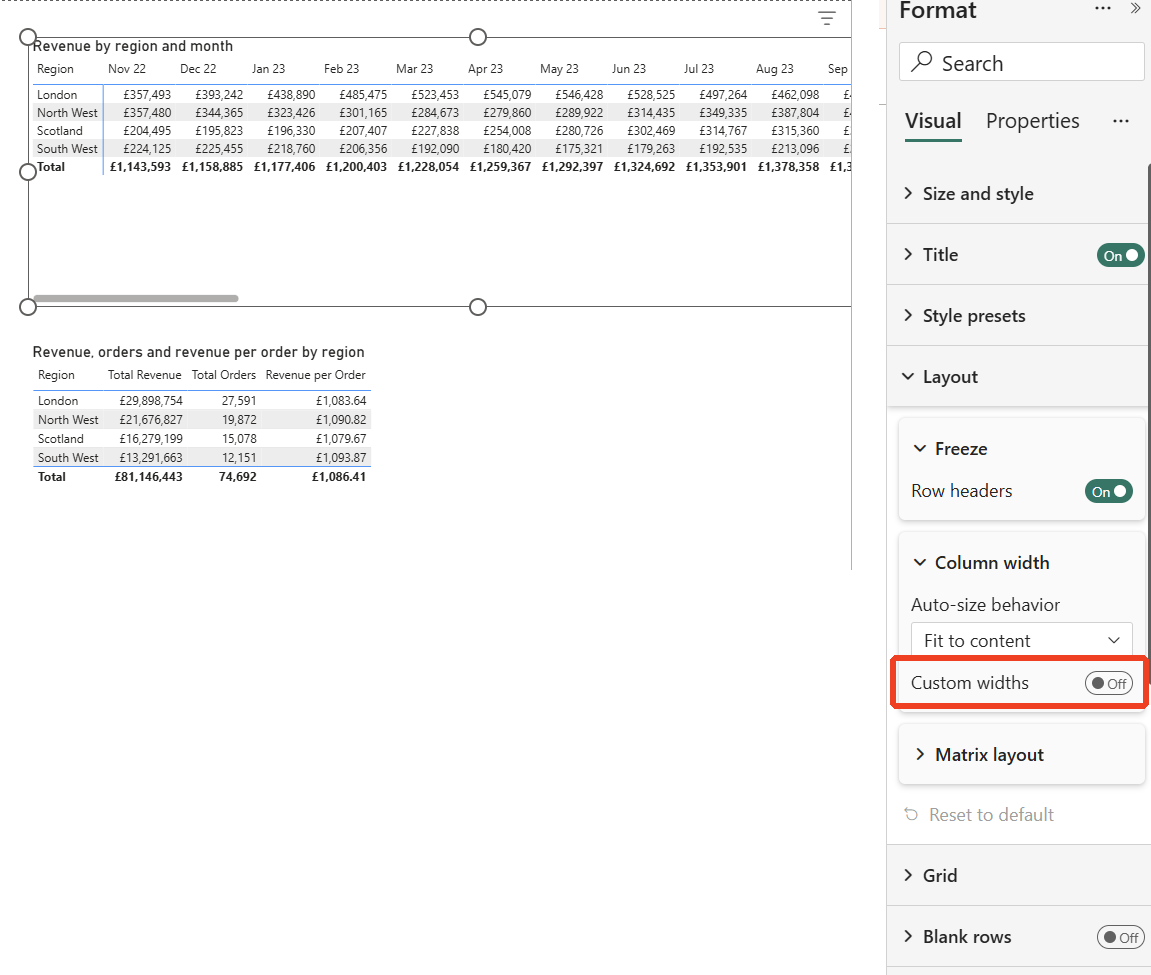
Before resizing anything, I checked the Format pane. Under Layout, Column width, the matrix had Auto-size behavior set to Fit to content and Custom widths switched off.
I then set the Region column to 200 px from the right-click menu. The column widened straight away. Back in the Format pane, Custom widths had been switched on, and the Region box showed 200 px. I tried it again on a fresh copy of the report to be sure. Same result.
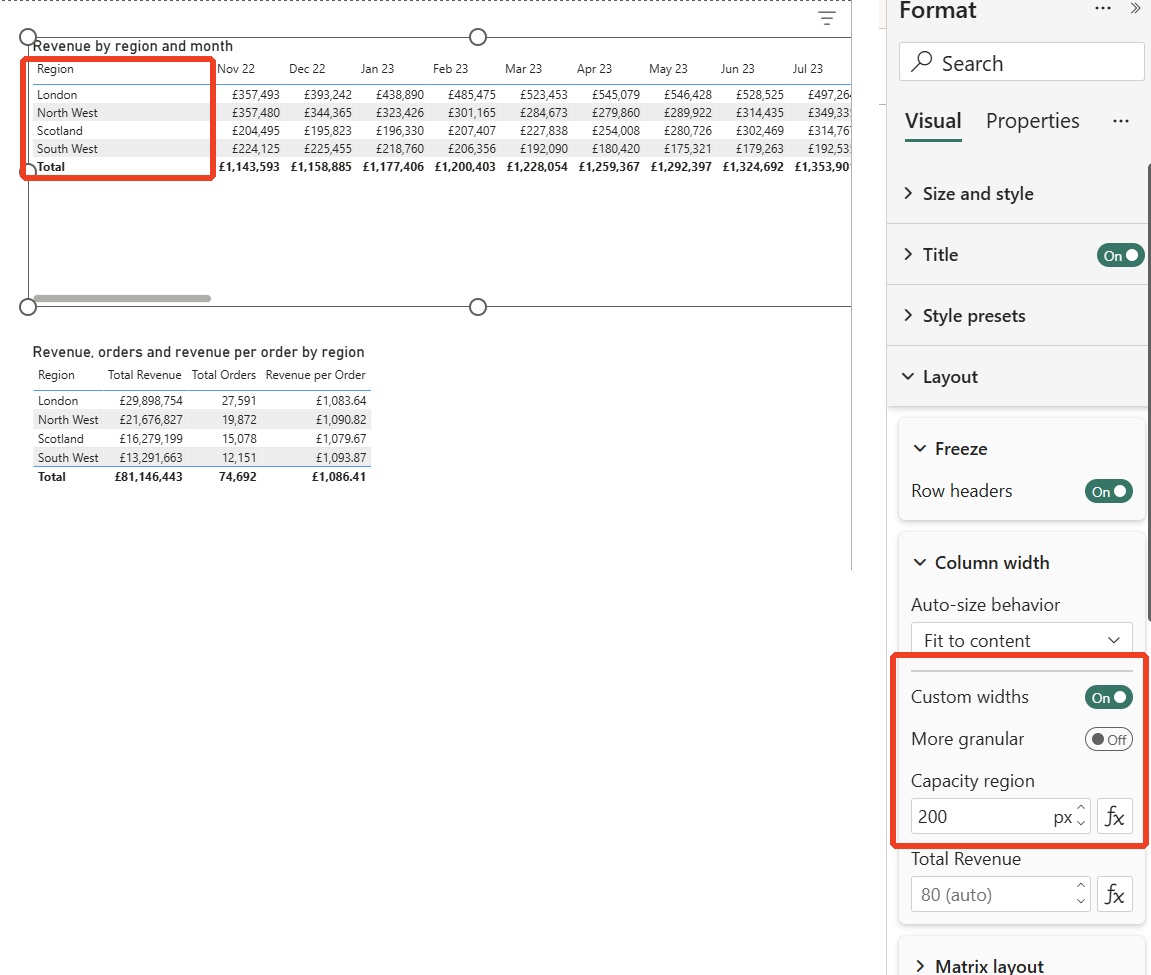
So in Desktop, the right-click resize is a shortcut to Custom widths rather than a separate setting. That matters because the width you type lands in the Format pane, and when you want automatic widths back, the menu had no reset option for authors, so the Format pane is where you undo it. Switching Custom widths off put my columns straight back to automatic widths.
Matrix columns that come from a field
The months across the top of my matrix behaved differently. In my test, resizing a single month header from the menu had no visible effect, whether Custom widths was off or on. The Format pane had one width box for the value (Total Revenue in my case), not one per month, and Microsoft says that for a matrix with hierarchies on columns, Custom widths sets a uniform width for the lowest level by default.
The Format pane also has a More granular toggle. Microsoft describes it for a matrix with hierarchies on columns too, to set widths for each combination individually. My matrix had a single field on columns, and I have not tested More granular.
One oddity, in my test the Format pane labelled the Region width box "Capacity region" rather than "Region" (you can see it in the screenshot above). It still controlled the Region column. My guess is a labelling bug?! Don't be thrown by it.
The viewer side
Microsoft's docs and the September release note call the option Set column width, with Reset column width to go back to the author's width. In Desktop the item I saw was called Resize column width, with no reset item, so the naming may differ between Desktop and the service. Microsoft describes viewer changes as applying only to that viewer and lasting for their current viewing session. I have not tested the viewer side in the service yet, so treat those details as Microsoft's rather than mine.
The gotchas
What I found in testing
- It changes a visual-level setting: the resize switched Custom widths on for that visual. To go back to automatic widths, switch it off in the Format pane.
- Clear the box before typing: the dialog starts with text such as "79 (auto)". In my first test I typed without clearing it and the resize did not apply.
- No reset in the Desktop menu: as an author, to go back to auto width, use the Format pane.
- Columns generated from a field did not resize from the menu: resizing one month header on its own had no visible effect.
- An odd label: the Region width box was labelled "Capacity region" in the Format pane.
What Microsoft documents
Both points below are from Microsoft's tables page.
- Viewer widths do not stick: a viewer's width applies only to them and lasts for their current viewing session. Good for not breaking anyone else's view, but do not let anyone treat it as a fix.
- Mobile layout is separate: the Column width settings can be changed independently for the mobile-optimised layout of a page, so check it separately.
Our view
- Typed widths beat dragging: dragging column edges by eye gives you slightly different widths every time. Typing the same number into every value column gives you a table that looks deliberate.
- Fix it once as the author: if a header is truncated for everyone, set the width properly so nobody has to resize it. A viewer's resize is a convenience, the author's width is the design.
How we use it at Metis BI
Column widths are a small thing, I know. But a table that looks cramped or cut off makes the whole page look unfinished. When we build or review reports, column widths, alignment and header wording are part of the finishing pass, not an afterthought. If your tables have grown messy over years of edits, our Power BI report development services cover tidying existing reports as well as new builds.
Summary
You can now set a table or matrix column's width in pixels from the right-click menu, which became generally available in the September 2026 update. In Power BI Desktop it shows as "Resize column width", and in my tests using it switched on Custom widths under Format, Layout, Column width, which is also where you undo it. Columns generated from a field, like months across a matrix, did not resize from the menu in my test. Microsoft says viewers get "Set column width" and "Reset column width", and what they change applies only to them for their current session. Set widths properly as the author, and treat the right-click option as a bonus for the people reading the report.