


Small multiples are a great way to show the same trend across regions, products or teams. One chart, split into panels, same axes, easy to compare. Until the September 2026 update, though, Microsoft's documentation listed small multiples among the visuals that visual calculations did not support, so a moving average in every panel meant a measure in the semantic model instead.
That changed when visual calculations for small multiples became generally available in the September 2026 update. In my test, a moving average per region was a right-click and one line of DAX, written on the visual itself.
Definition: Microsoft describes a visual calculation as DAX that runs directly on a visual instead of in the semantic model and that is stored on that visual. Microsoft adds that when a visual uses small multiples, the small multiples field appears on an axis called ROWPAGES, which you can use to calculate across the panels.
Key takeaways:
- Fast to add: in my test, right-click the visual, New visual calculation, pick a template such as Moving average.
- Runs per panel by default: also in my test the moving average restarted for each region.
- ROWPAGES is the small multiples axis: Microsoft says to use it when you want the calculation to move across panels instead of within them.
- It lives on the visual, not the model: in my view, good for presentation maths, wrong for business definitions.
Adding one, from right-click to green tick
Right-click the small multiples chart and choose New visual calculation. The menu listed Custom, Running sum, Moving average, Percent of parent, Percent of grand total, Average of children, Versus previous, Versus next, Versus first, Versus last, Look up a value with context and Look up a value with totals - long list, I know!
When I picked Moving average, Power BI switched into visual calculation edit mode, with a starter formula:
Moving average = MOVINGAVERAGE([Field], WindowSize)For a 3-month window on revenue, that becomes:
3-month moving average = MOVINGAVERAGE([Total Revenue], 3)Selecting the green tick on the formula bar commits it.
Edit mode shows the chart on top, the formula bar in the middle and a grid of the visual's own data underneath. To get back into an existing calculation, the right-click menu only offered New visual calculation. Use the pencil icon next to the calculation in the Build pane instead.
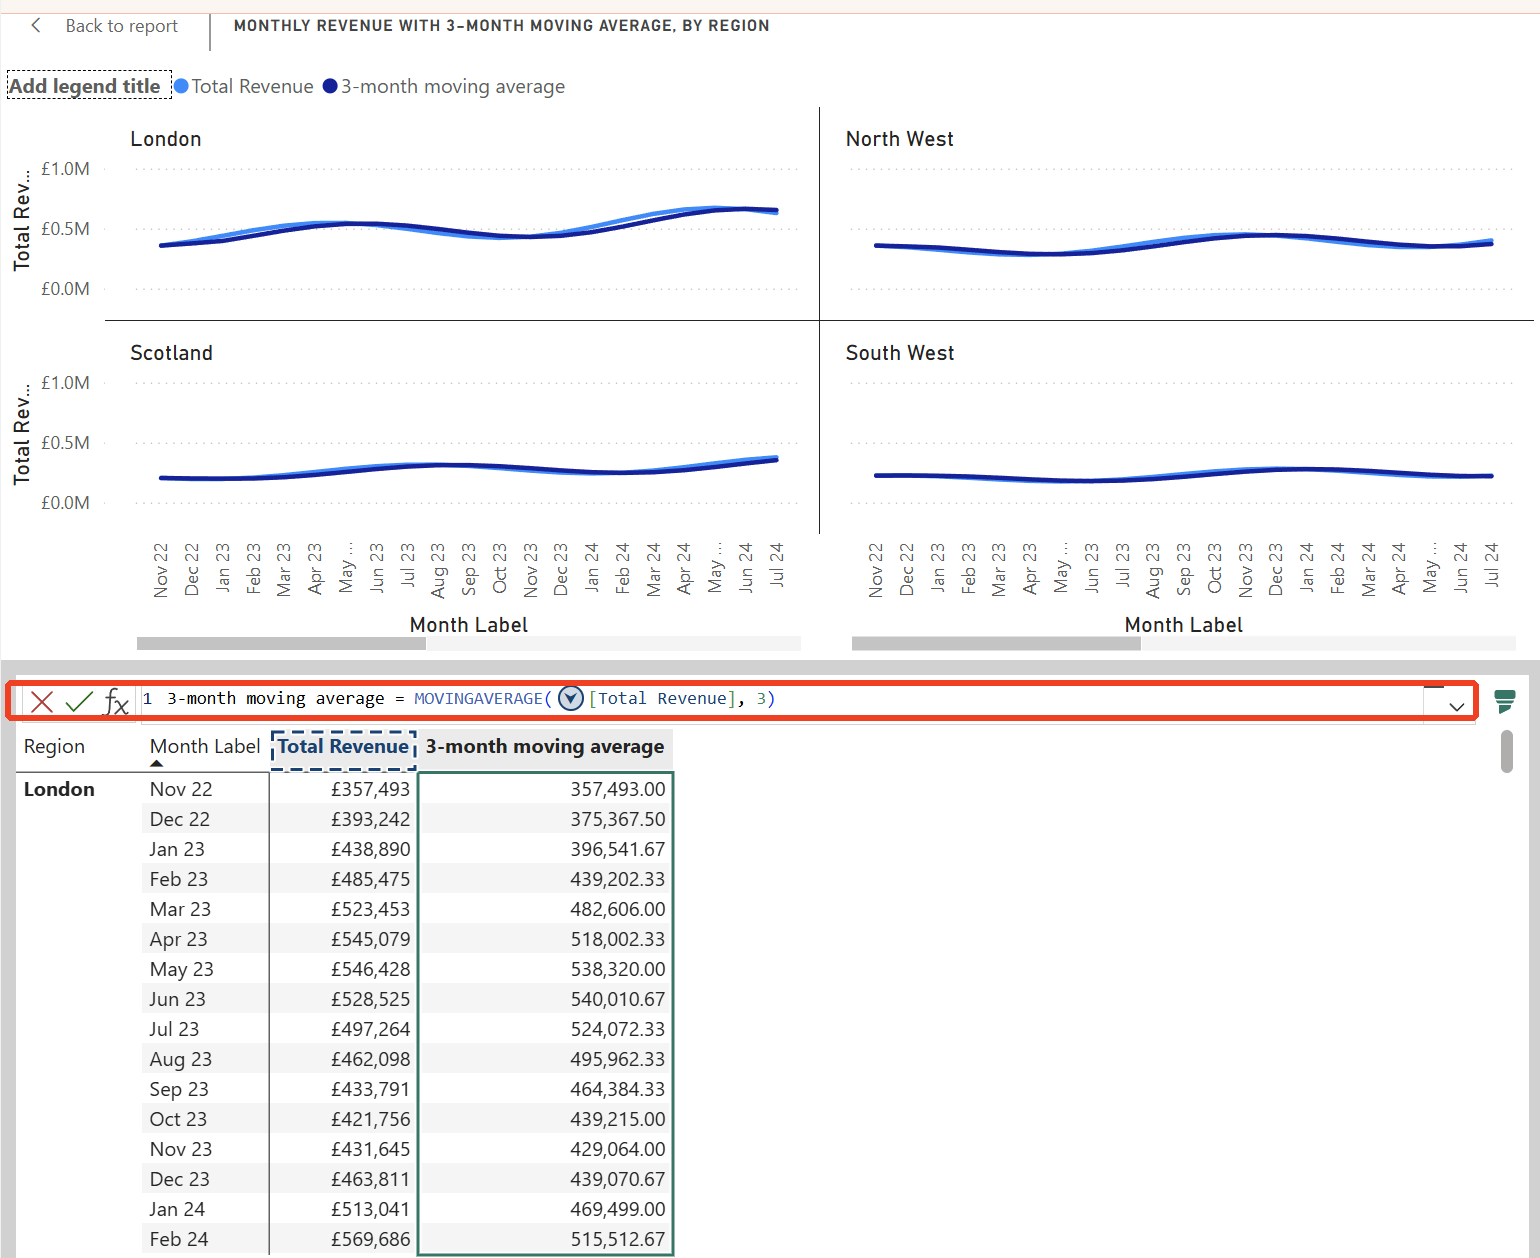
Once committed, every region panel gained a second line and the chart got a legend with Total Revenue and the moving average.
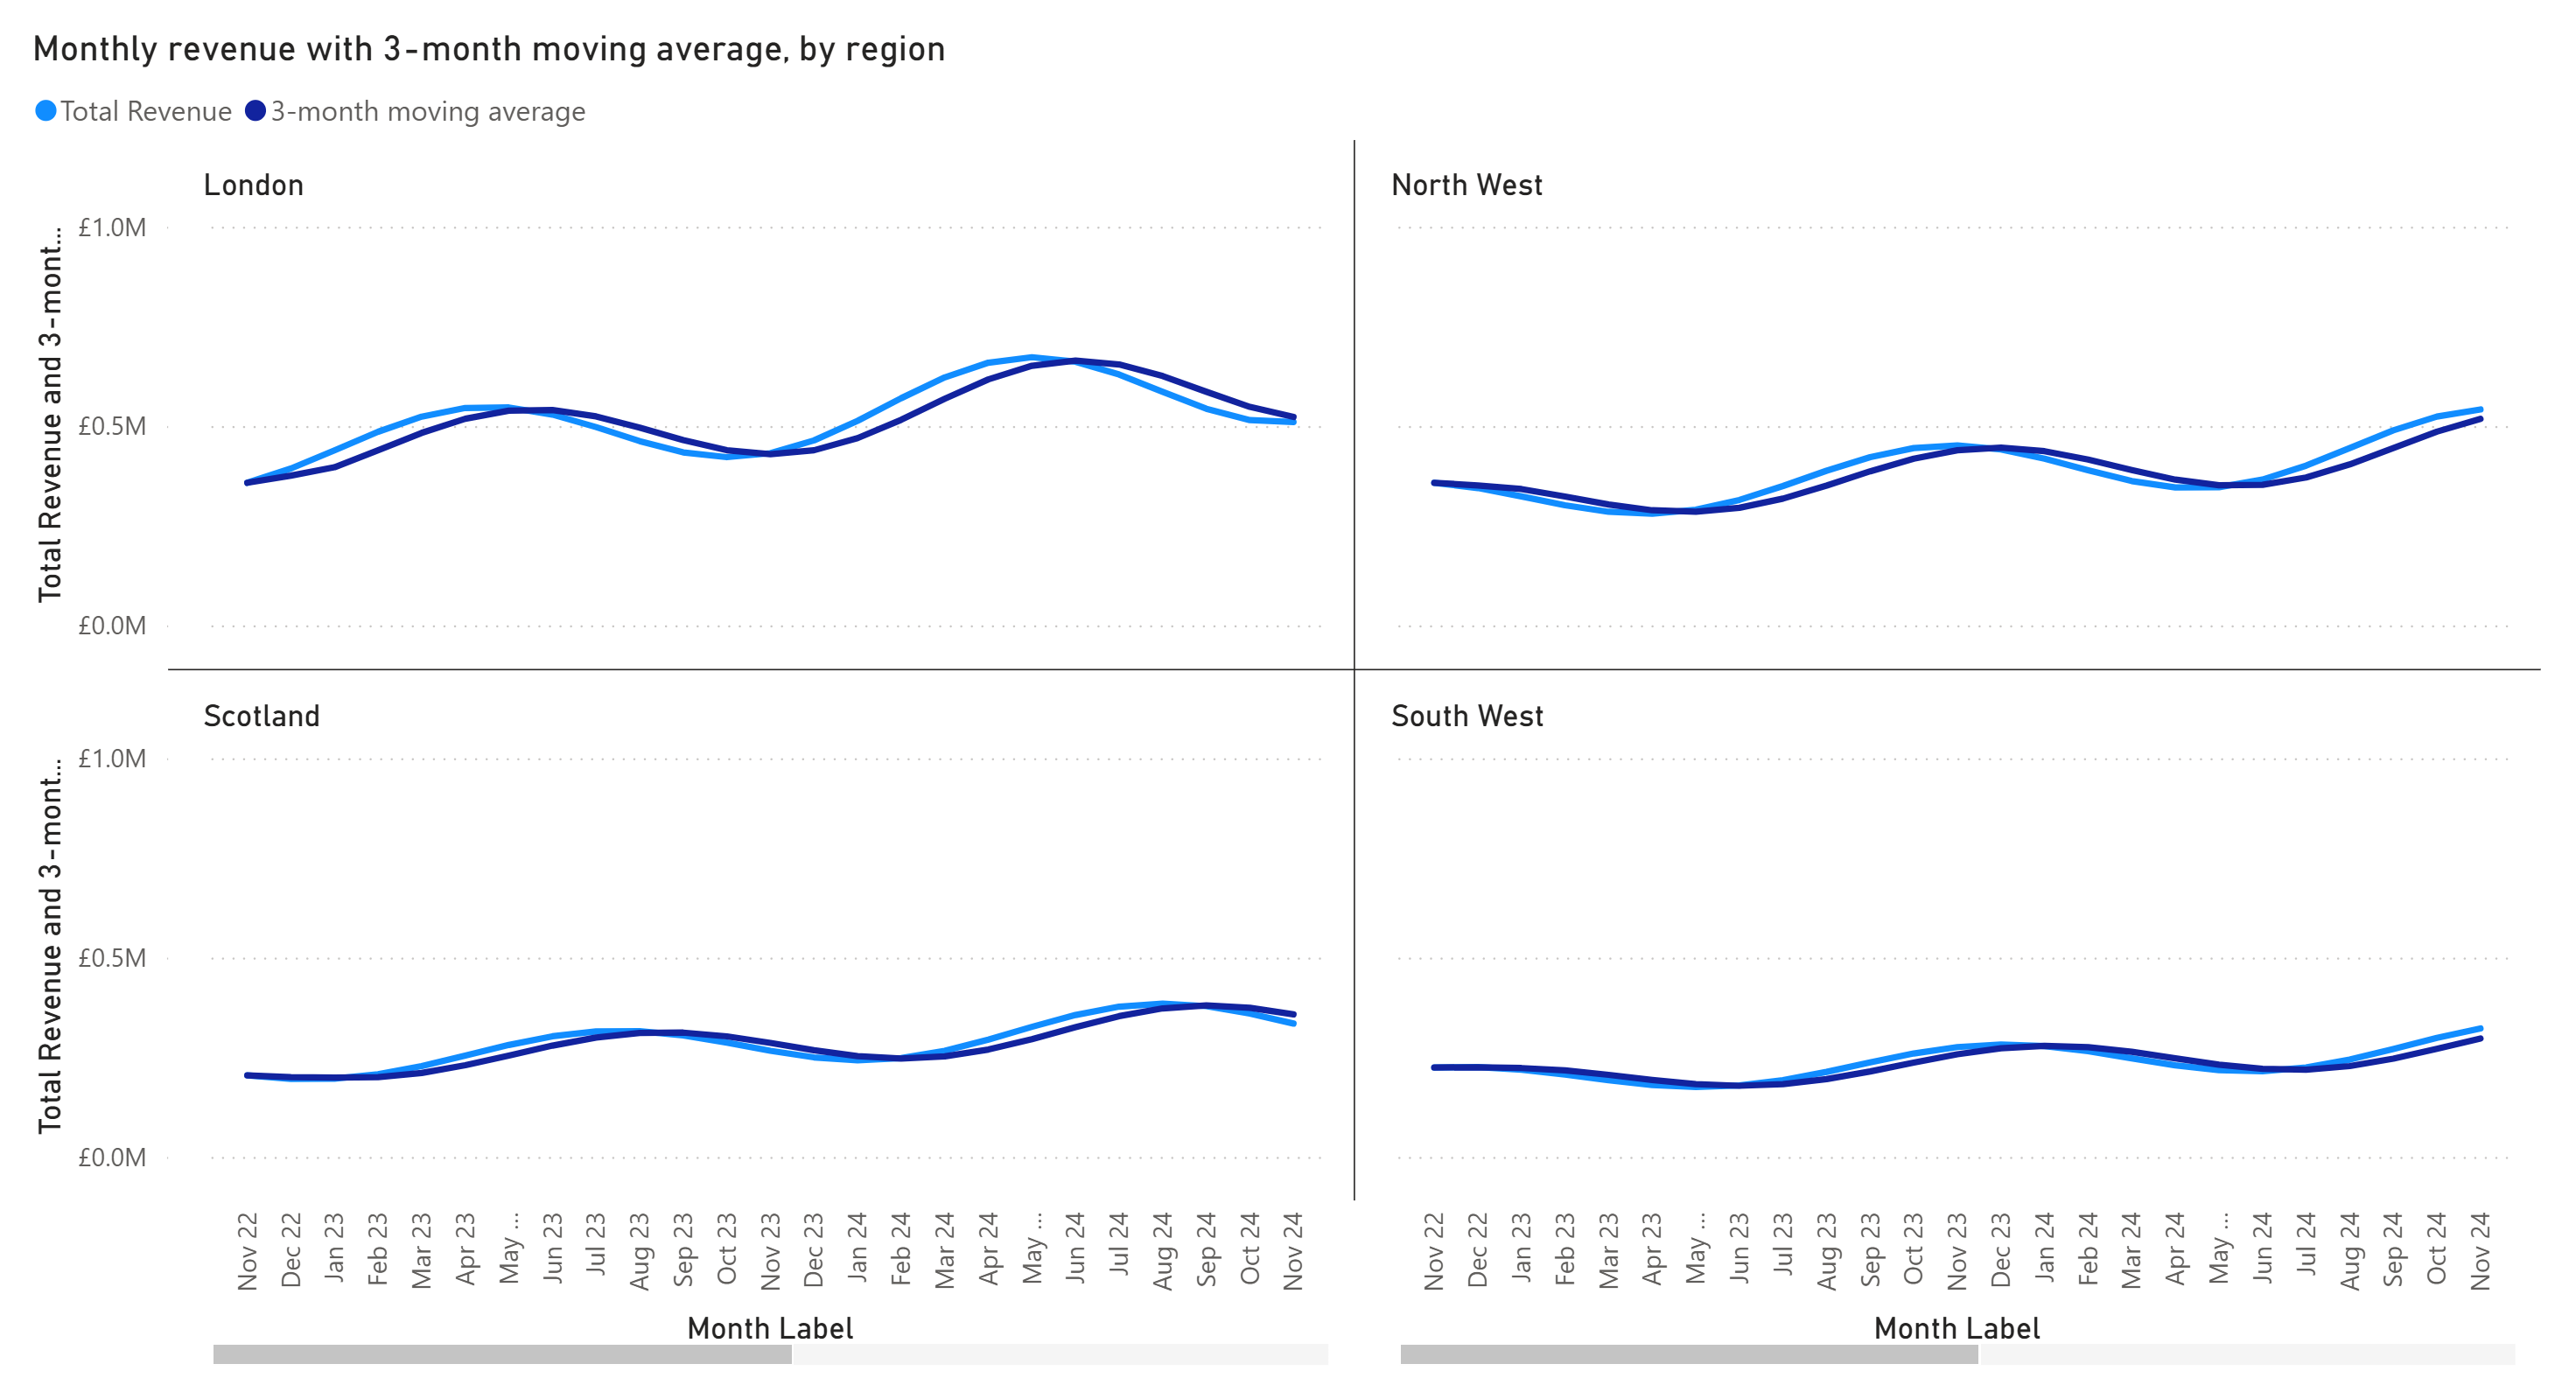
Then I checked the numbers. Why bother? Because a moving average that quietly runs across the wrong boundary is worse than none at all. I reviewd the values below myself as well, and they matched what Power BI showed.
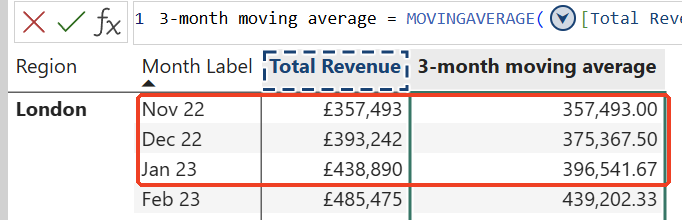
The window is partial at the start: London's first month (November 2022, £357,493) equals its own revenue. The second month averages 2 months, (357,493 + 393,242) / 2 = 375,367.50. From the third month it averages 3, 396,541.67 for January 2023.
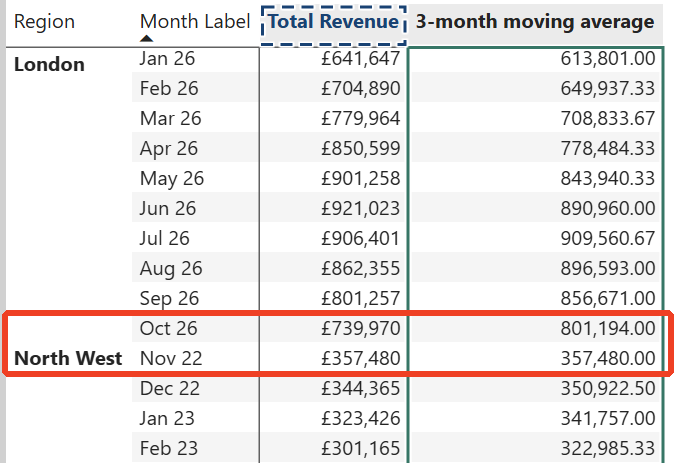
It restarts for each region: London's last month (October 2026) shows 801,194.00. The very next row is North West, November 2022, at 357,480.00, which is exactly North West's own revenue for that month. Nothing carried over from London.
What if you wanted the opposite, say a running total that carries on from London into North West? Microsoft's answer is the axis argument. Using ROWS ROWPAGES as the axis calculates across the rows and then across the small multiples, other combinations with ROWPAGES change the order, and a separate Reset parameter decides where the calculation starts again. I have only tested the default behaviour so far, which kept each panel separate. That is what I would want for a moving average.
Visual calculation or model measure?
Hold on... before you rewrite half your measures as visual calculations. The question I always ask is where a calculation belongs.
A moving average on a trend chart is presentation. It smooths the line so the eye sees the direction, and nobody needs "three-month moving average of revenue in the regional chart" defined in a business glossary. To me that's a good fit for a visual calculation, it keeps clutter out of the model and it sits right next to the chart that needs it.
Something like "Revenue vs Budget %" is different. It is a business definition, it should mean the same thing on every report, and it needs to be governed, described and reused. I would put that in the semantic model, where it can be documented and picked up by other reports. I go into why the model matters so much in the semantic model and why it matters more in the age of AI.
The gotchas
What I found in testing
- Editing is not on the right-click menu: use the pencil icon next to the calculation in the Build pane.
What Microsoft documents
All 4 points below are from Microsoft's visual calculations documentation. I have not tested them myself:
- Exports leave them out: data exports do not include visual calculation results. If your users live in Export to Excel, the moving average will not be in their spreadsheet.
- One visual only: a calculation cannot be copied or reused on another visual. Five charts that need the same moving average means writing it 5 times.
- Some visuals cannot host them: Microsoft keeps a list of unsupported visuals, with slicers and custom visuals among them, so check it before you plan around one.
- No filtering or sorting on them: you cannot filter or sort by a visual calculation.
How we use it at Metis BI
We use visual calculations for presentation maths like the moving average above, and keep business definitions in the semantic model. When we review reports, where each calculation lives is one of the things we look at, because logic spread across individual visuals is hard to see until 2 reports disagree. If you want reports that are quick to build and still consistent with each other, that balance is part of our Power BI report development services.
Summary
Visual calculations became generally available for small multiples in the September 2026 update. Right-click, New visual calculation, pick a template, and in my test I got a moving average in every panel without touching the model. In my tests the moving average was correct, used a partial window at the start, and restarted for each region, and the numbers matched my own working. Microsoft says the small multiples field sits on the ROWPAGES axis if you need to calculate across panels, and that visual calculation results do not come through in data exports. Use them for presentation and keep business definitions in the semantic model.