


Field parameters let the person reading a report choose what a chart is split by: region, category, product, whatever you give them. But here's the thing... what should the chart show when they pick 2 of those at once?
That's what Auto expand answers. Auto expand on the hierarchy axis of bar, column and line charts, with field parameter support, became generally available in the October 2026 update. Microsoft pitches it as bringing charts into line with how slicers and matrices already expand and says readers get the same behaviour through Personalize this visual.
Definition: Auto expand is a setting under X-axis, followed by Values. Microsoft's feature summary says that when people pick several fields in a field parameter slicer, the chart expands the hierarchy automatically instead of staying at the top level.
Key takeaways, all from my own testing:
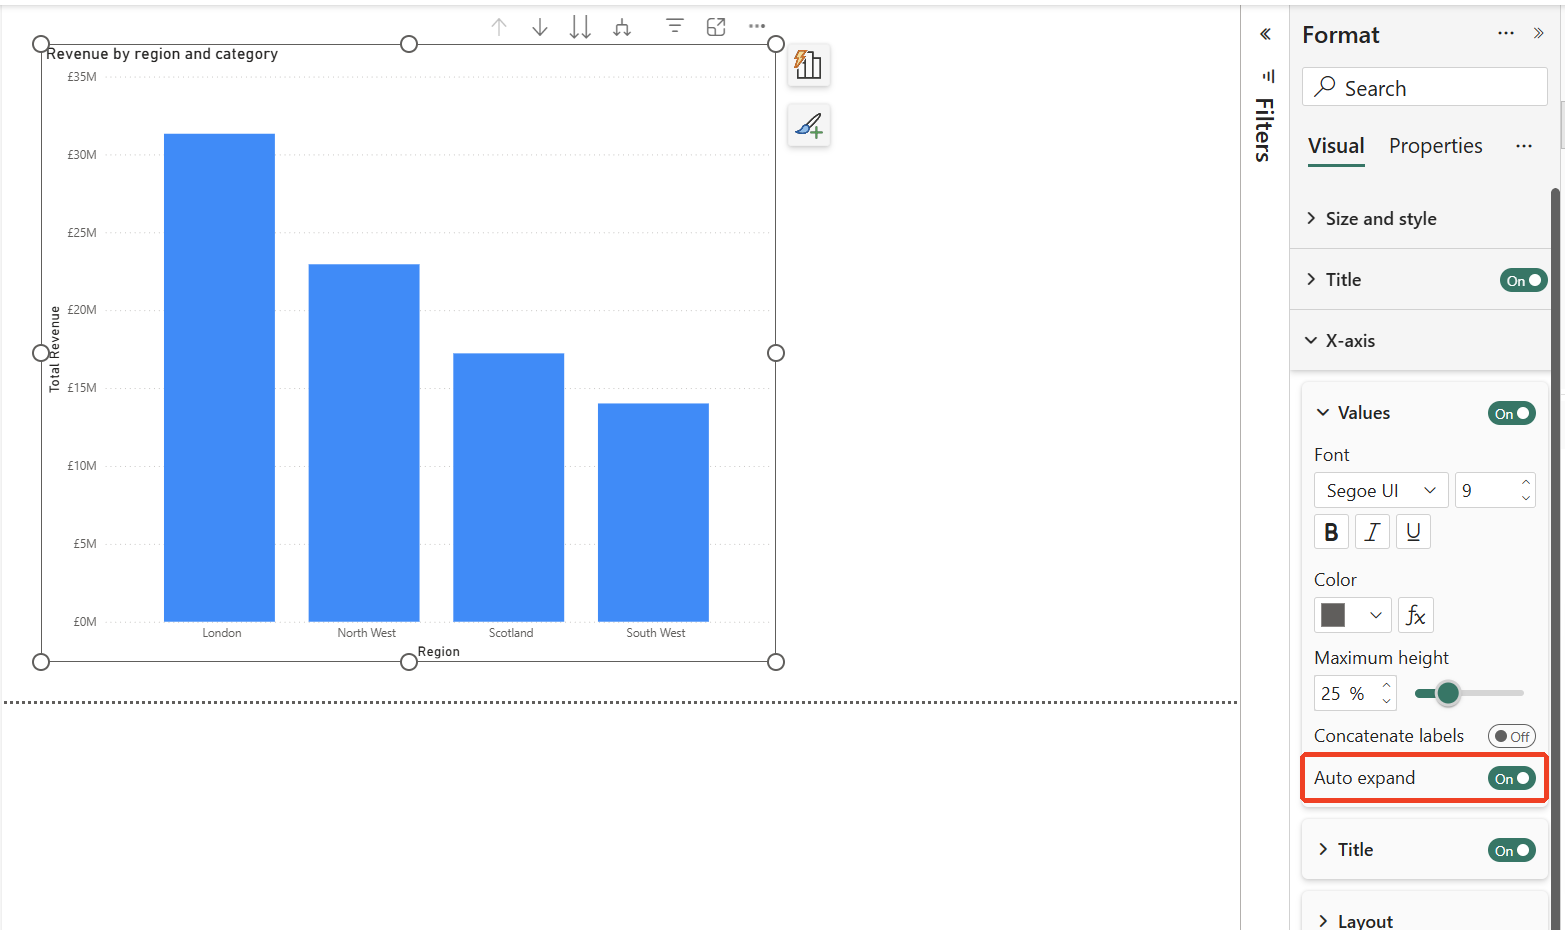
- Where it lives: Format visual > X-axis > Values > Auto expand. In my test it was on by default.
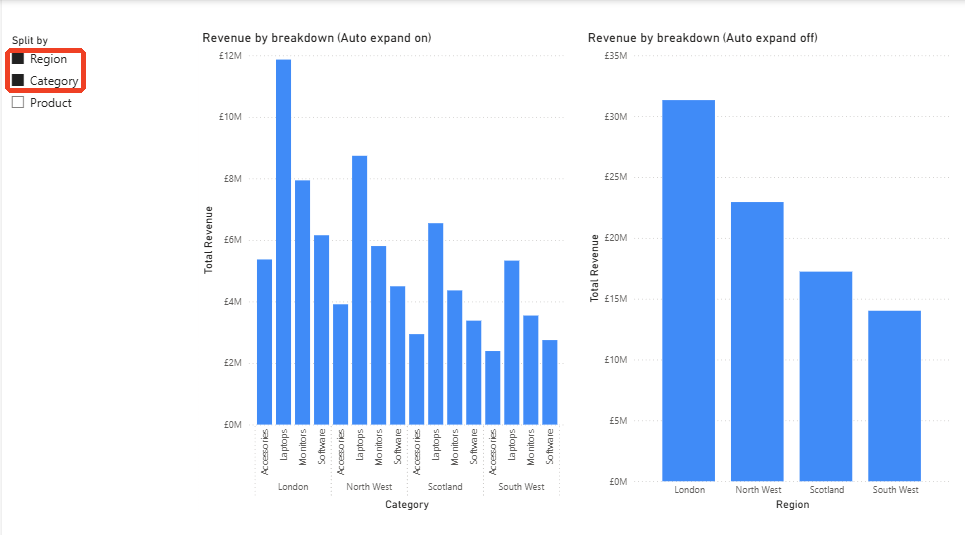
- What it changes: with it on, picking Region and Category in a field parameter slicer showed Category within Region. With it off, the chart stayed on Region.
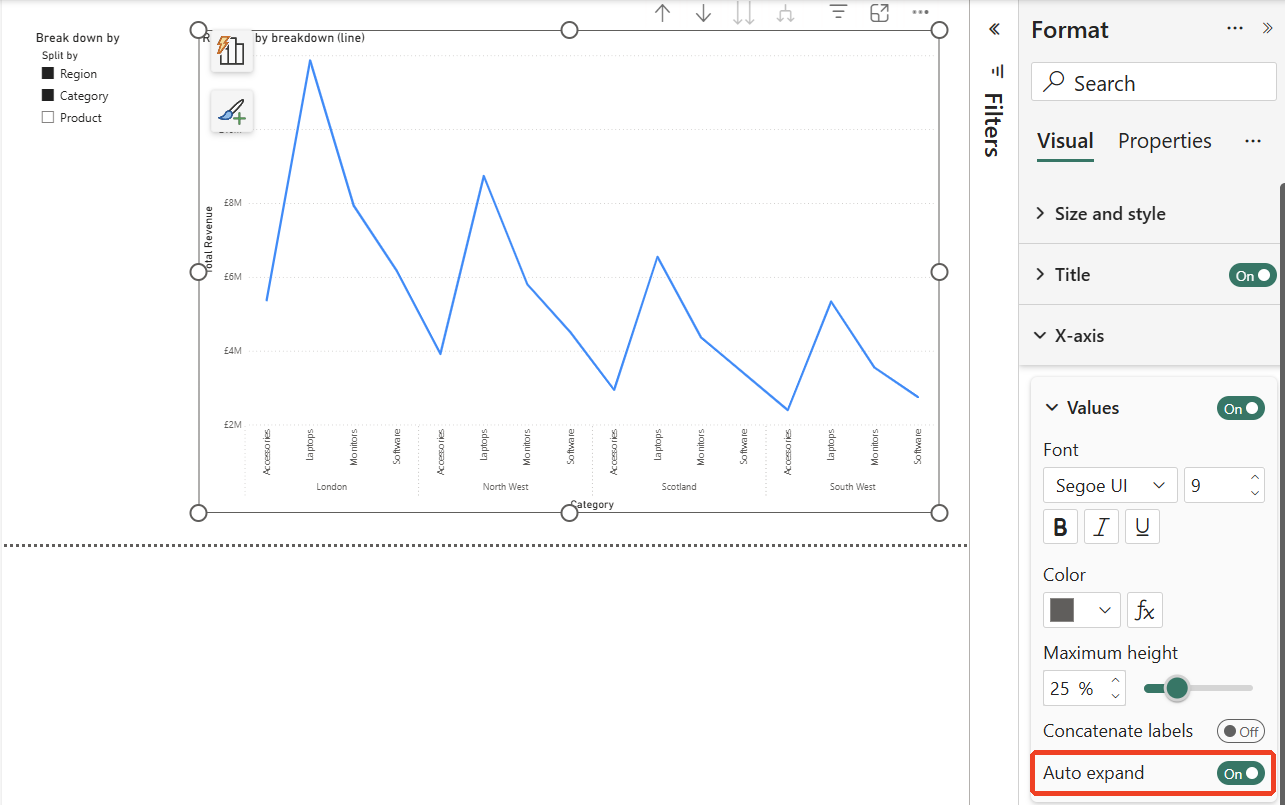
- Line charts too: a line chart expanded the same way.
Setting it up with a field parameter
I started with a column chart of revenue with Region and Category on the X-axis. It opened showing only Region, 4 bars, with the Auto expand switch under X-axis > Values already on.
Then I tried it with a field parameter. I created one from Modeling > New parameter > Fields, named it "Split by", added Region, Category and Product in that order, and kept "Add slicer to this page" ticked. Power BI wrote this table for me:
Split by =
{
    ( "Region",   NAMEOF ( 'Sales'[Region] ),   0 ),
    ( "Category", NAMEOF ( 'Sales'[Category] ), 1 ),
    ( "Product",  NAMEOF ( 'Sales'[Product] ),  2 )
}
I then put the Split by parameter on the X-axis of 2 identical column charts. With nothing picked in the parameter slicer, both charts went all the way down to Product, grouped under Category and Region, with a scrollbar.
On versus off
I switched Auto expand off on the right-hand chart only, then picked Region in the slicer and added Category with Ctrl+click. The left chart, with Auto expand on, expanded to Category within Region: 16 bars. The right chart, with it off, stayed on Region: 4 bars. Both had the same 2 fields selected.
Line charts too
Line charts expand the same way. With Auto expand on and Region and Category picked, the line ran through Category within Region, 16 points, with the regions grouped along the axis.
Two to watch: empty slicers and dates
Clear the parameter slicer and Power BI treats every field as selected, which Microsoft documents too. With Auto expand on, my charts went all the way down to Product, scrollbar and all. So check what the page looks like with the slicer cleared before you publish it.
Dates are the other one, though I haven’t tried this myself. Microsoft says a date column using auto date/time loses its date hierarchy inside a field parameter, so build the parameter from explicit year, quarter, month and day columns.
Should you leave it on?
Where people change the breakdown themselves, I would. Expanding to what they picked is what they’ll expect. If one summary chart should stay at the top level whatever gets picked, switch it off on that chart only.
Where we use field parameters
We use them where people genuinely need to switch the breakdown, which saves building 5 versions of the same chart. Where the story shouldn’t move, the chart stays fixed. Making that call page by page is part of our Power BI report development services.
Summary
Auto expand, generally available since the October 2026 update, decides what a bar, column or line chart shows when someone picks several fields in a field parameter. In my test, column and line charts expanded to the lowest level picked when it was on, and stayed at the top level when it was off. It was on by default when I tried it, so the real decision is which charts to switch off.