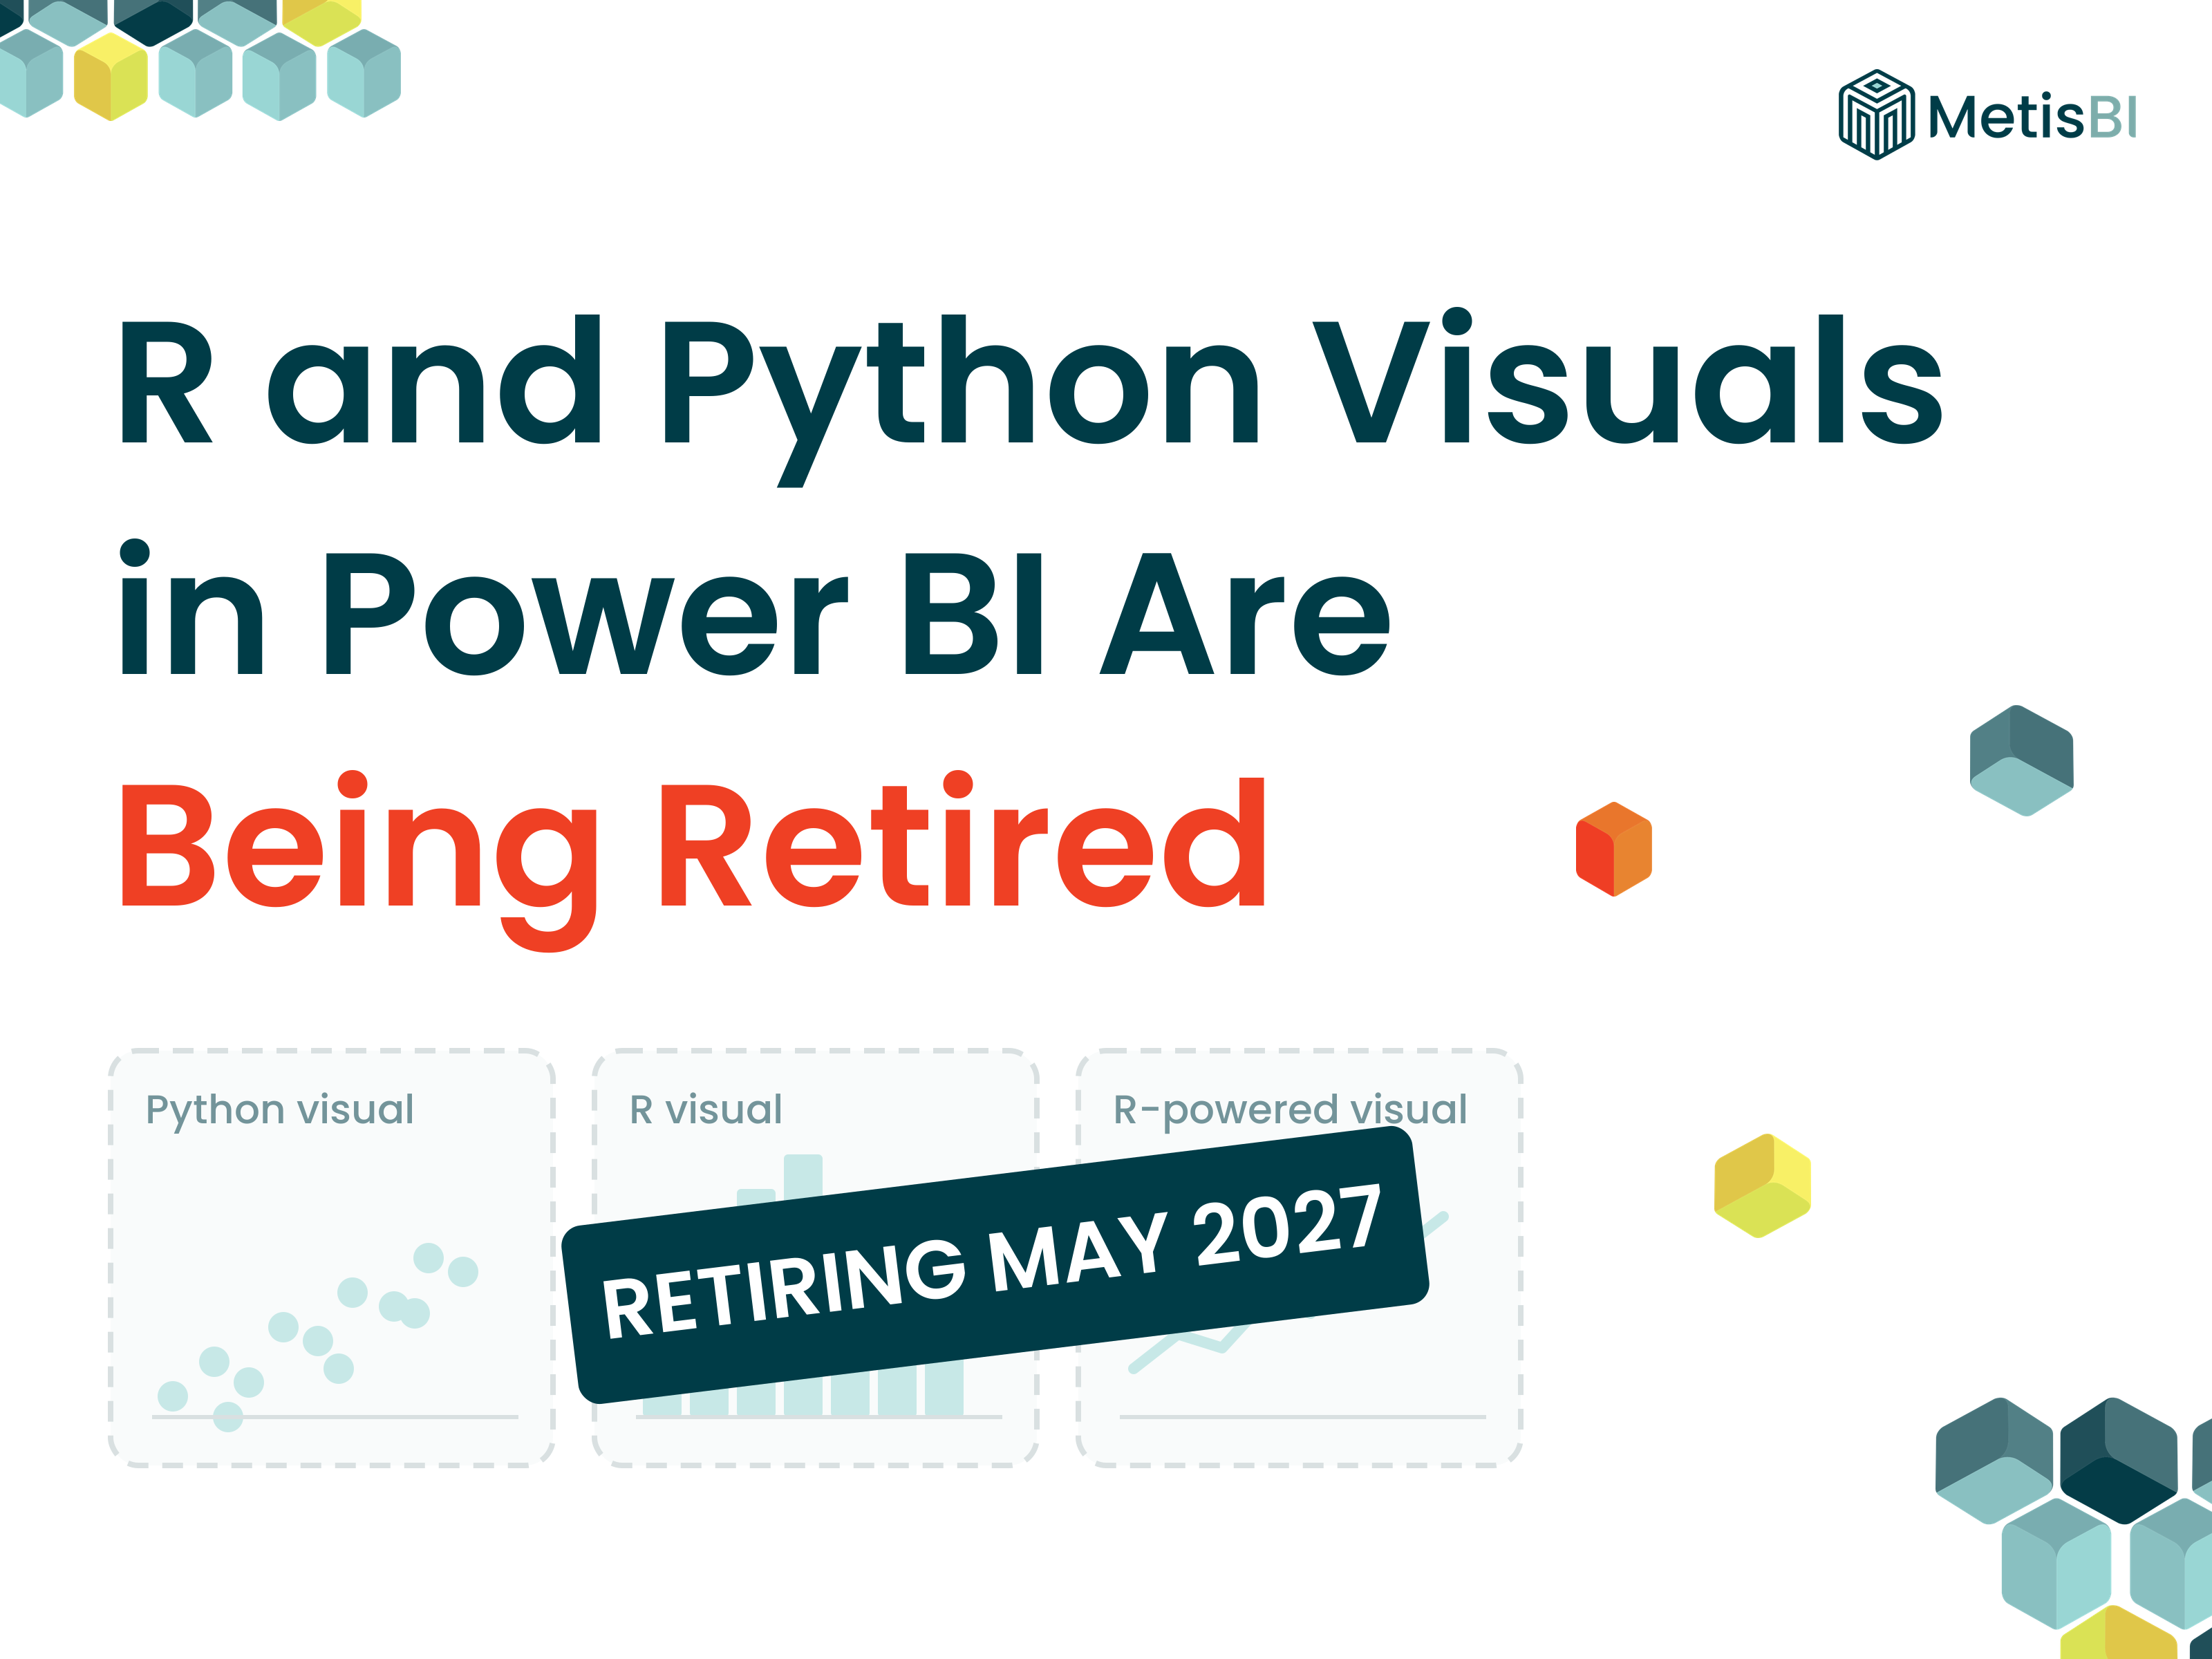


Microsoft has announced the retirement of R and Python visuals in Power BI, with the date set for May 2027. Here is a plain rundown of what is changing, what is not, and what to do if your reports use them.
The short version
R and Python visuals let you draw a chart in a Power BI report using an R or Python script. Microsoft is retiring them, along with R-powered custom visuals from AppSource, in May 2027. From then, they stop working in the Power BI service, including in reports published before that date, and future versions of Power BI Desktop won't include them. Python scripts used in Power Query to load tables are not affected.
Key points:
- Scope: the R visual, the Python visual and R-powered custom visuals.
- Existing reports are included: anything already published stops rendering at retirement, so replacements need to be in place before May 2027.
- No automatic conversion: each visual has to be rebuilt another way.
- Power Query is out of scope: Python scripts that populate tables carry on as before.
- Embedded reports went first: in Embed for your customers and Publish to web, these visuals have shown as blank since May 2026.
What exactly is being retired
A script visual takes the fields you add, passes them to your R or Python script, and shows the chart the script draws as an image on the canvas. In Power BI Desktop the script runs on your own R or Python installation. In the Power BI service (app.powerbi.com) it runs in a secured environment where only supported packages are available.
Three things are covered by the retirement:
- The R visual: charts drawn with R scripts and R packages.
- The Python visual: charts drawn with Python libraries such as pandas and Matplotlib.
- R-powered custom visuals: visuals from AppSource that run R under the hood, without you writing any R yourself.
That last group is easy to miss, as using an R-powered custom visual doesn't feel like scripting.
[IMAGE: Power BI Desktop Visualizations pane with the R script visual and Python script visual icons highlighted | Where: after the paragraph on R-powered custom visuals | Purpose: shows readers exactly which icons are affected]
The R and Python Script Visuals in Power BI Desktop
What changes, and when
The retirement lands in May 2027. At the time of writing Microsoft has not given a specific day, so I'd work to the start of May.
- Power BI service: at retirement, all R and Python visuals stop working in published reports, including reports published before the date.
- Future versions of Power BI Desktop: R and Python visuals are removed, so you won't be able to add them to reports.
- Older versions of Power BI Desktop: R and Python visuals keep rendering locally, using the R or Python installation on your machine.
I wouldn't read that last point as a workaround. Your users consume reports in the service, and that is where these visuals stop.
There is no automatic conversion. Every R and Python visual needs a deliberate replacement before May 2027.
The full detail sits in Microsoft's script visuals overview on Microsoft Learn.
What is not affected
The retirement applies only to R and Python visuals in interactive Power BI reports. Python scripts used in Power Query to populate tables are explicitly out of scope, so if you use Python to shape or load data, that carries on.
Microsoft's wording names Python in Power Query specifically and says nothing either way about R scripts in Power Query. If you rely on those, keep an eye on the documentation.
This follows an earlier change to embedded reports
Part of this has already happened. Microsoft announced in November 2025 that R and Python visuals would no longer be supported in Embed for your customers (also known as app owns data) and Publish to web. Since 1 May 2026, reports in those scenarios still load, but the R and Python visuals show as blank. The May 2027 retirement extends that to the Power BI service and Desktop.
How to find the R and Python visuals in your reports
Microsoft is clear that no migration within a report recreates an R or Python visual exactly. Each one has to be replaced, which means the first job is knowing where they are.
- Build an inventory: list every report with an R or Python visual, then save the scripts and the packages they depend on.
- Search your PBIP files: if your reports are saved in Power BI Project (PBIP) format with Git integration, search the report definitions in source control for the visualType values pythonVisual (Python visuals) and scriptVisual (R visuals).
- Check custom visuals separately: that search won't pick up R-powered custom visuals, so review the custom visuals in each report on their own.
- Tell your users: let the people who rely on the affected reports know what is changing and when, and test each replacement before the date. If you only view an affected report, contact its owner.
[IMAGE: VS Code search across a PBIP repository for "pythonVisual" and "scriptVisual", showing matching visual.json files across several reports | Where: after the inventory bullets | Purpose: demonstrates the quickest way to find affected visuals at scale]
Finding R and Python Visuals Across PBIP Reports
What to replace them with
Microsoft's guidance gives three options for rebuilding the visual inside the report:
- A built-in Power BI visual.
- An existing custom visual, from AppSource or your organisation.
- A new custom visual built with the Power BI custom visuals SDK. Microsoft notes that AI coding tools can help here.
Where the visualisation can't be rebuilt in a Power BI report, there are two options outside it:
- Fabric notebooks: recreate the analysis and the chart in a notebook. You may need to update scripts for the supported languages, libraries and data access.
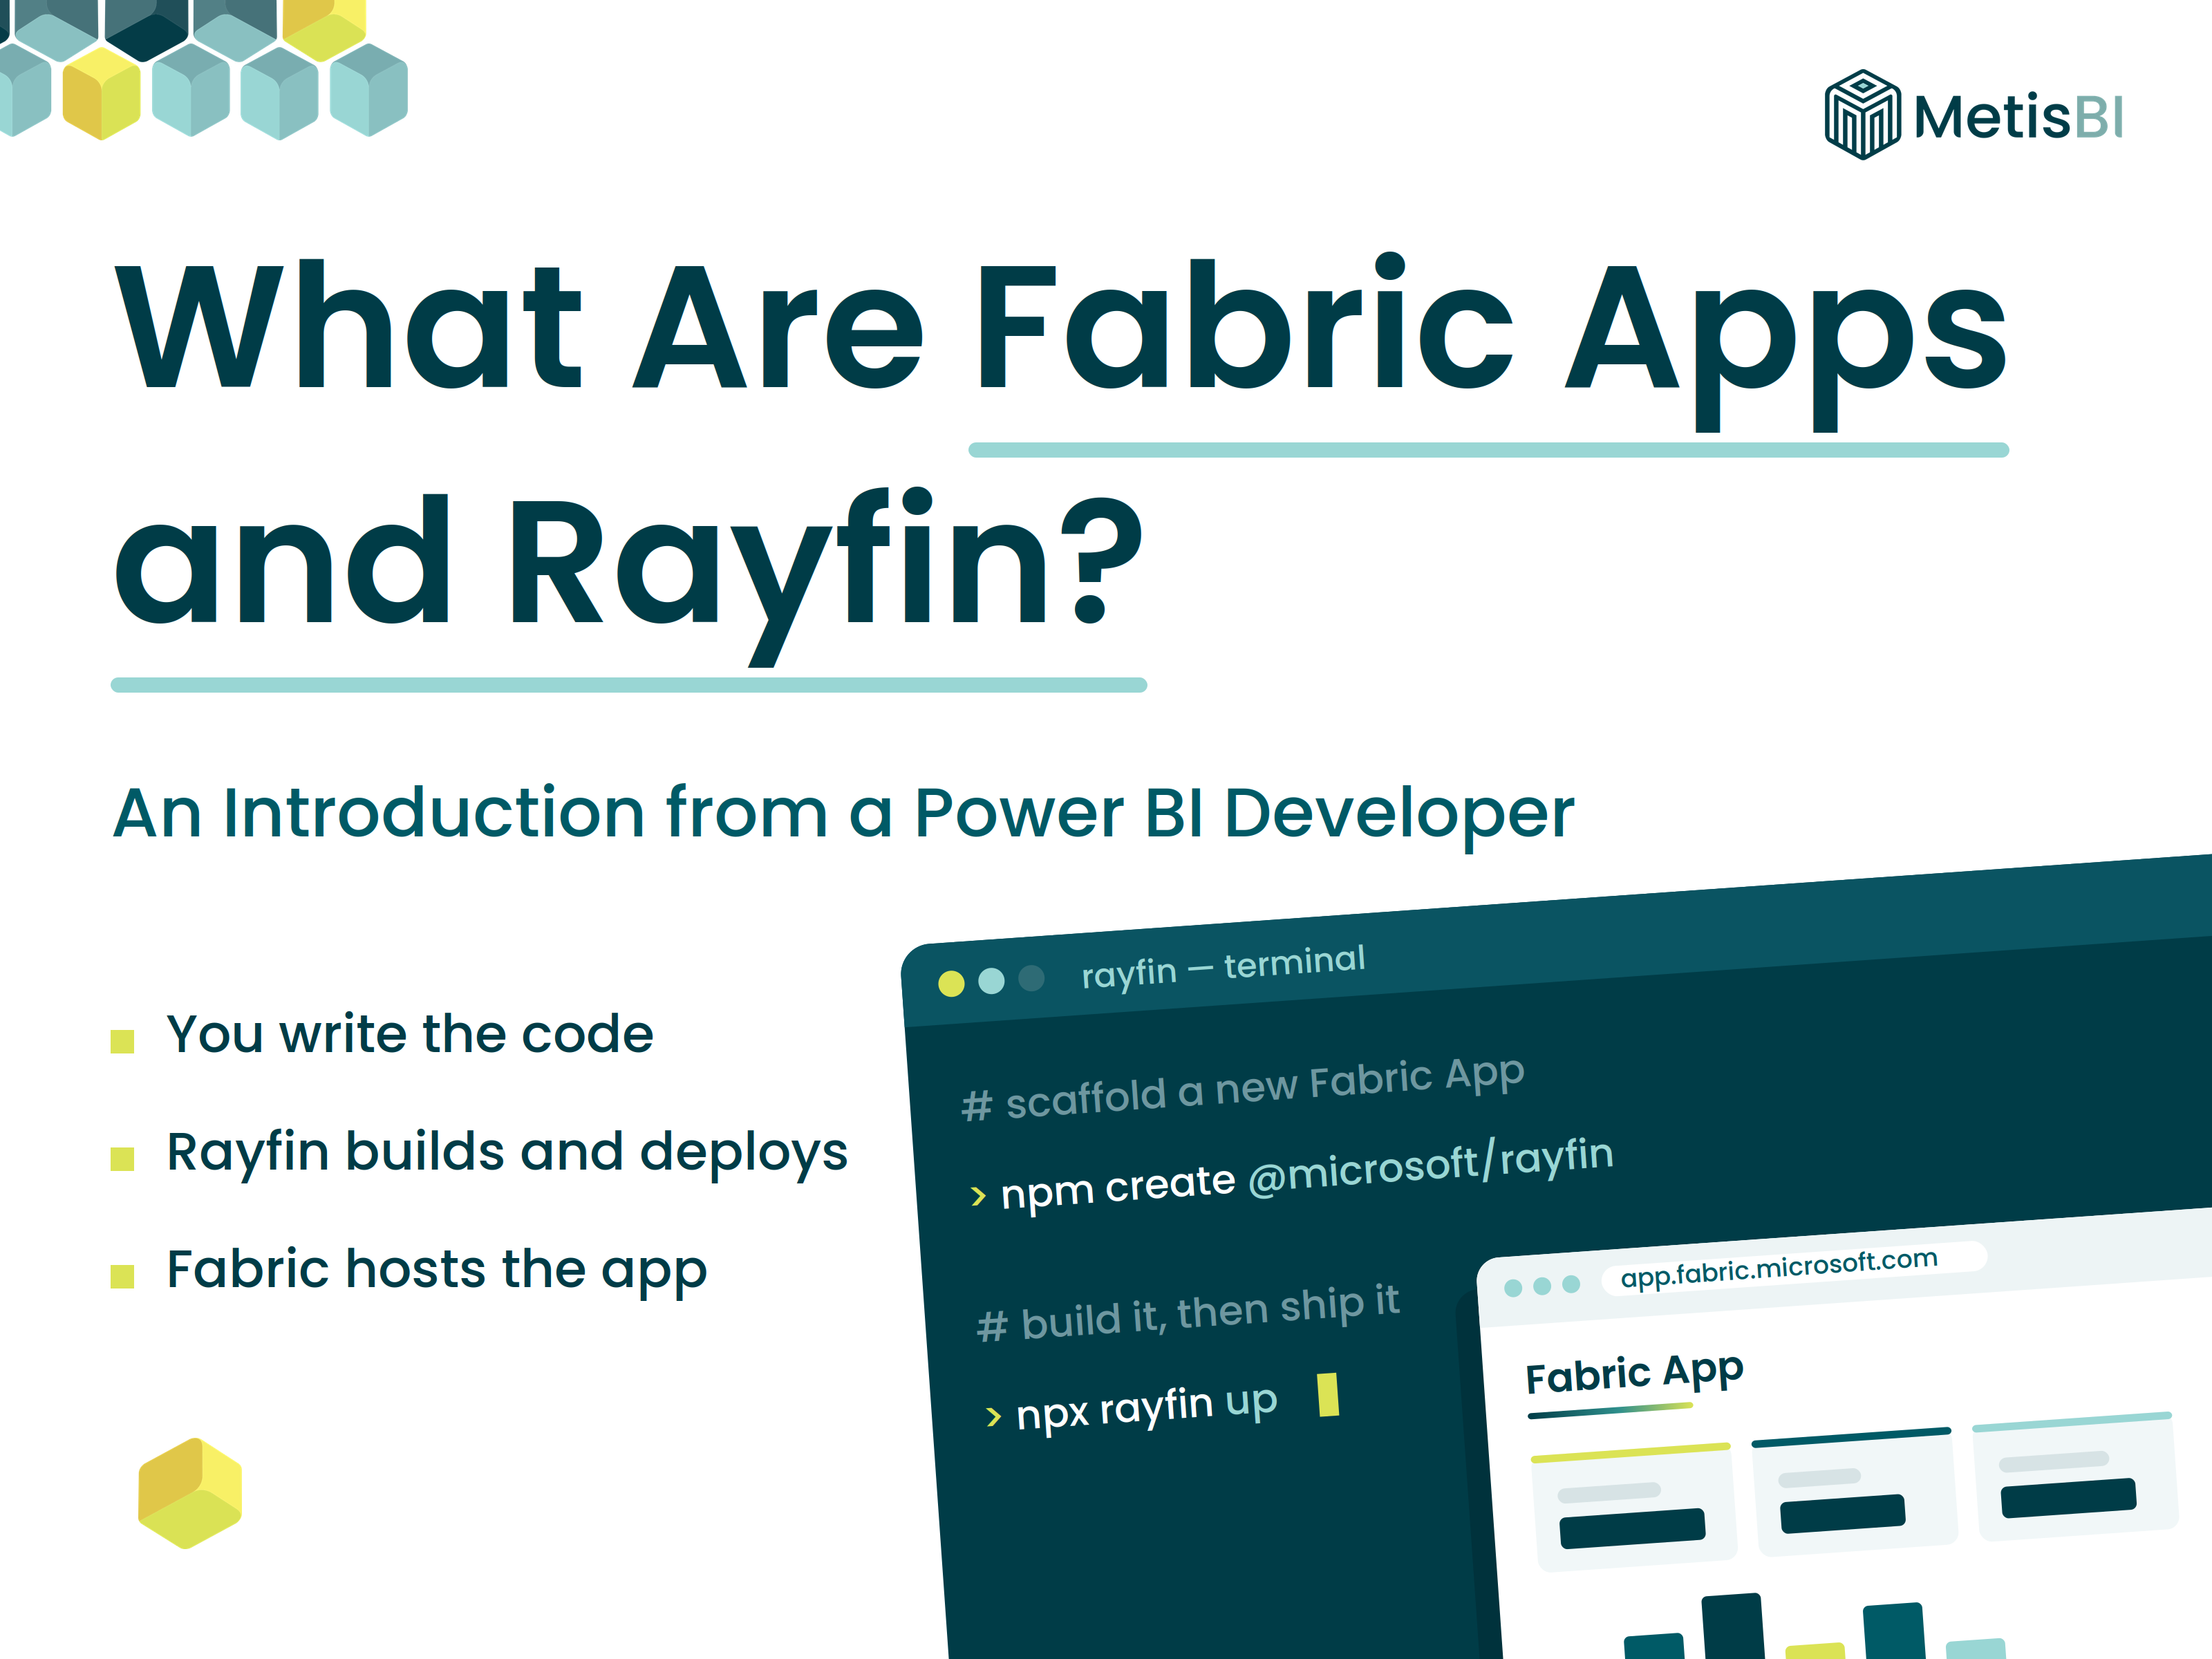
- Fabric Apps: for visualisations that can't be recreated in a report. Fabric Apps are in preview and not yet available in every region, so I'd treat this one as watch rather than adopt for anything critical.
Both can be added to an org app, so your audience still gets them alongside their reports.
Microsoft's announcement also mentions that the Power BI roadmap includes planned HTML and Vega core visuals. That is a roadmap item, not something you can use today, so I wouldn't plan around it for a May 2027 deadline.
My take on choosing the replacement
Here's the thing. A script visual renders as a static image. Other visuals can filter it, but you can't click it to cross-filter anything else, and it shows no tooltips. So for plenty of charts that were built in R or Python, a native visual could well be an improvement in how people actually use the report.
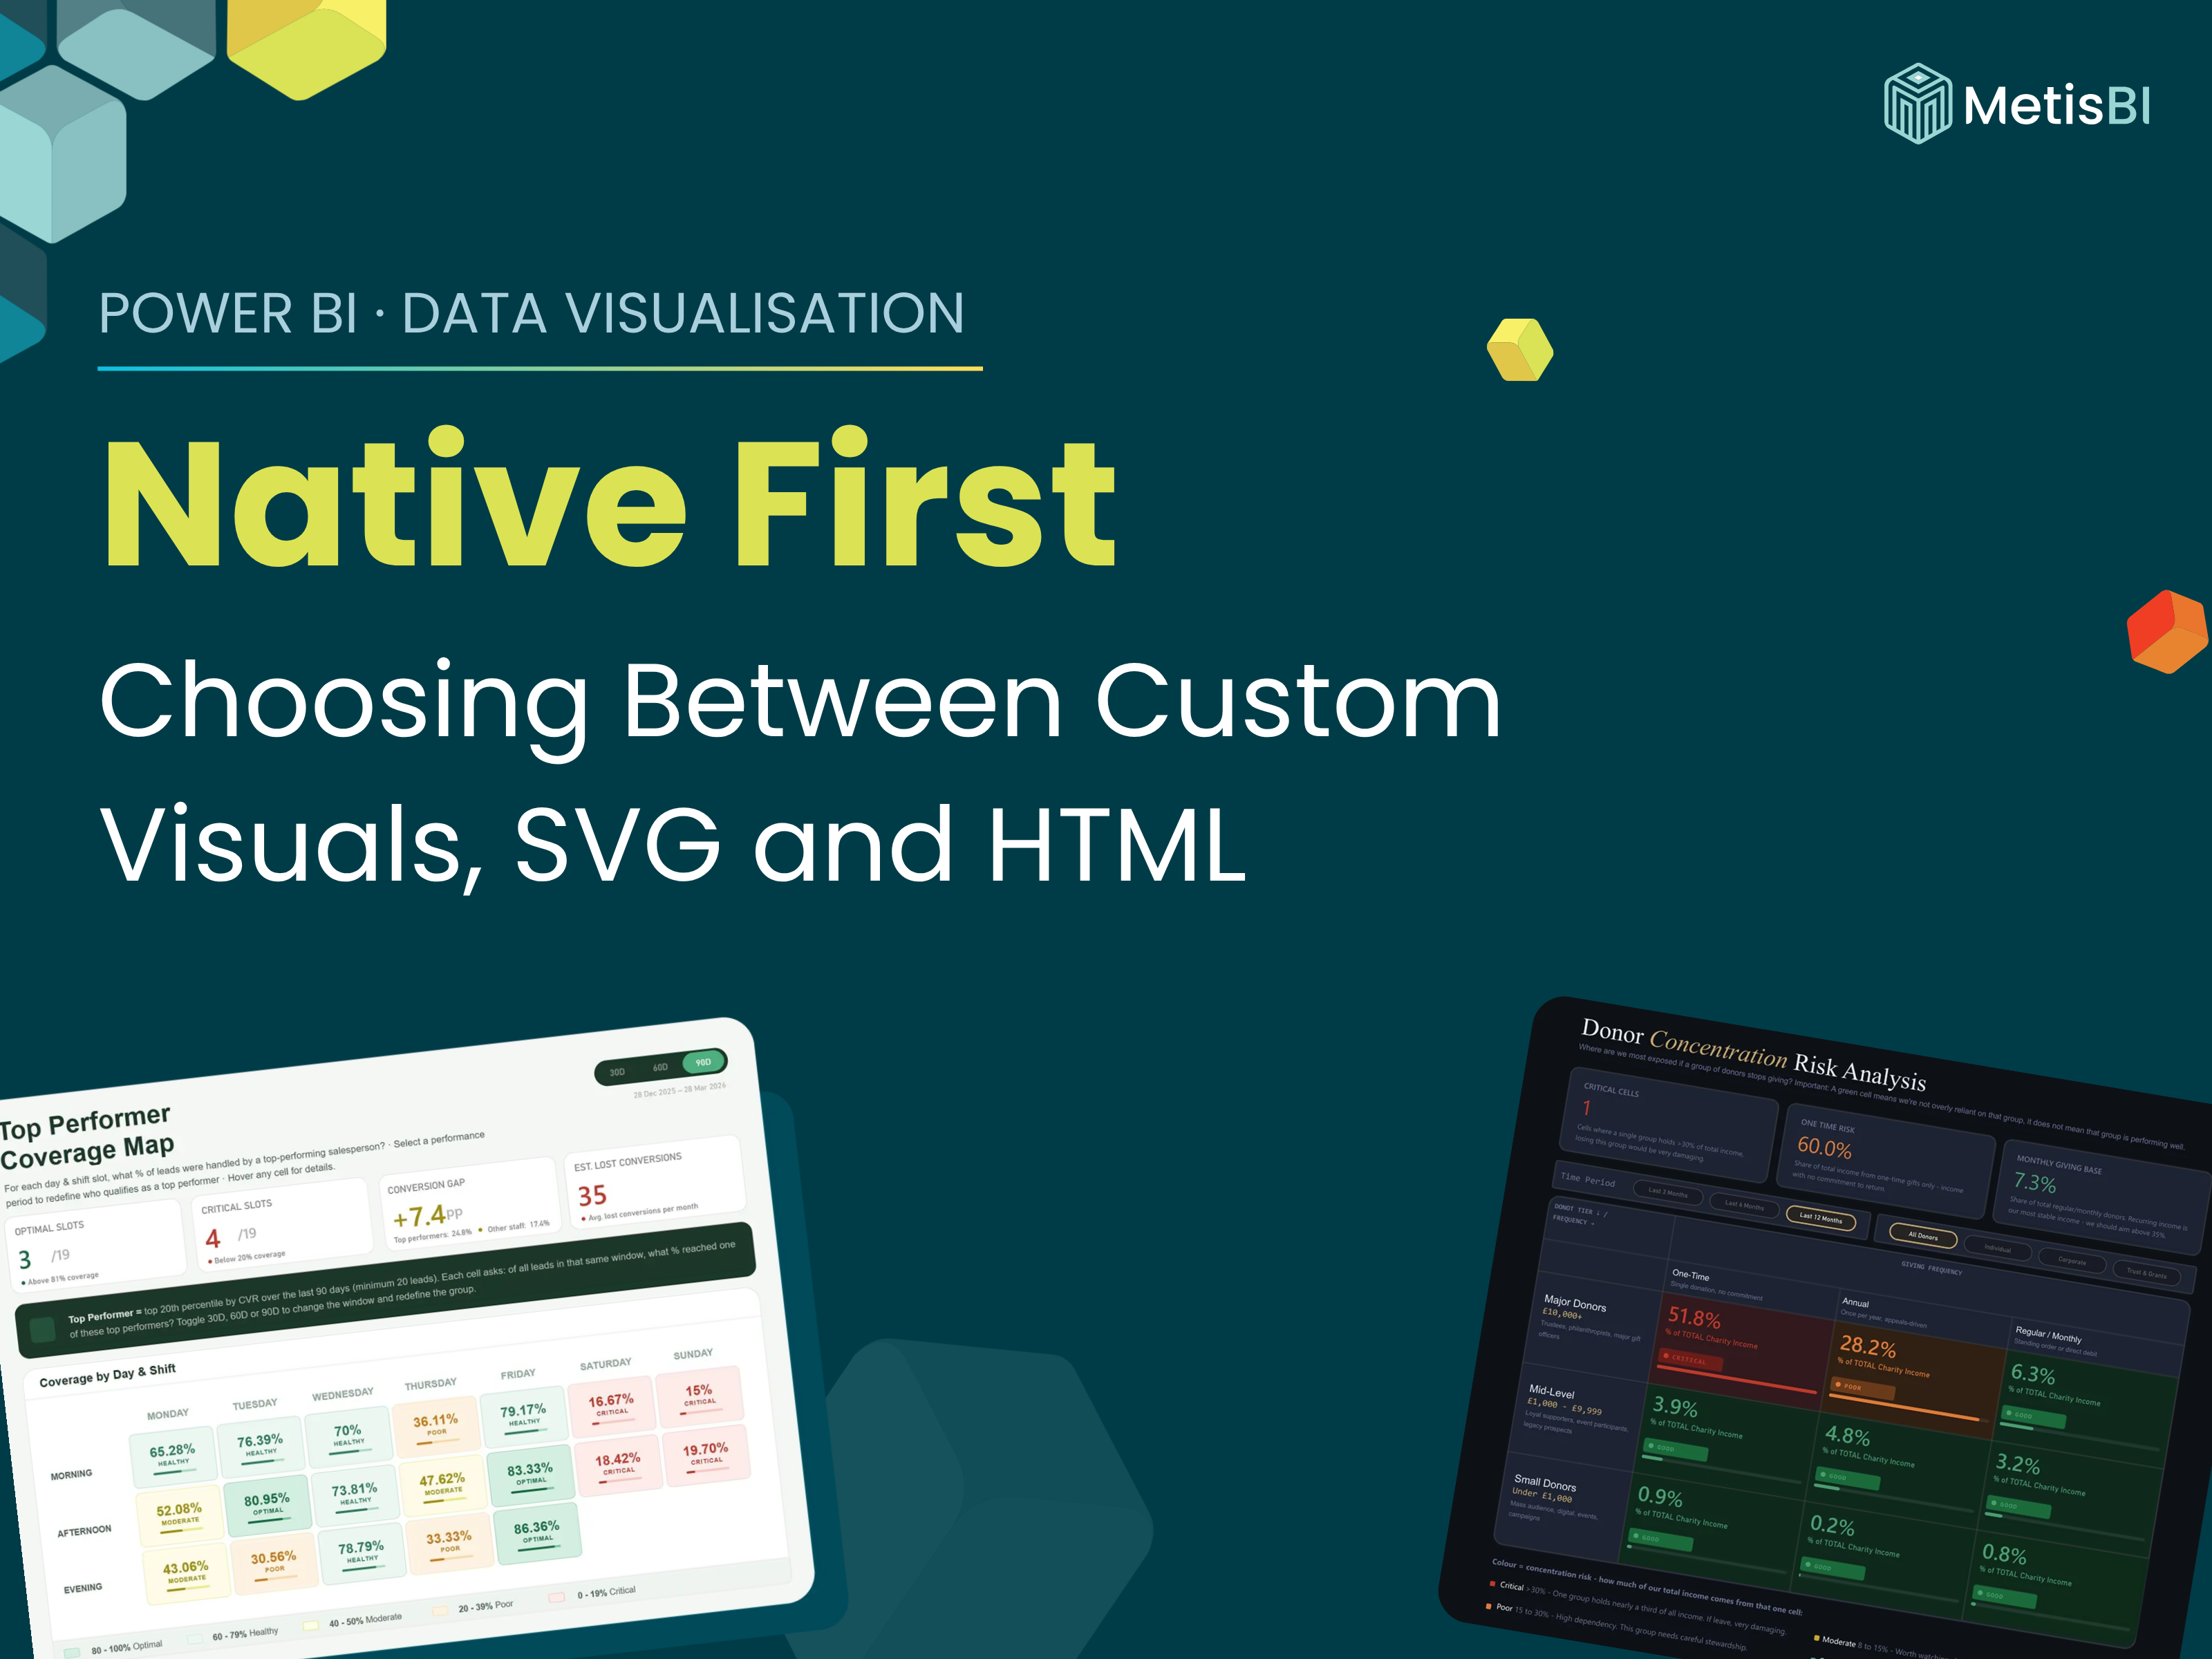
I'm a native visuals first person, and I'd start every replacement there. If you need to go beyond the standard native or out-of-the-box visuals, whether that's a certified custom visual, an SVG measure or HTML, I've covered how I choose between them in Choosing the Right Visual in Power BI: Native, Custom Visuals, SVG and HTML. For a quick answer, push native as far as it will go and only step up when it genuinely can't do the job, as each step up brings more to govern and maintain.
Swapping out a handful of visuals can be quick. It gets harder when a script holds logic nobody has documented. If you'd like help finding what's affected and rebuilding it in a way your own team can maintain, learn more about our Power BI report development services.
Another retirement to have on your radar
R and Python visuals are not the only feature leaving Power BI. Q&A retires in February 2027, a few months earlier, and the Q&A visual, the dashboard question box and Q&A Setup all go with it. I've covered that one in Power BI Q&A Retirement in February 2027: What Breaks and How To Migrate to Copilot.
Both come back to the same question, do you know what is actually in your reports? If that's hard to answer, it's a sign your governance needs to catch up with how Power BI has grown.
Summary
R and Python visuals in Power BI, including R-powered custom visuals, retire in May 2027 and stop working in the Power BI service, existing reports included. Python in Power Query isn't affected. There's no automatic conversion, so find the visuals, save the scripts, pick a replacement for each one and tell your users before the date.