"Build a full dashboard in 3 minutes with AI." I see a version of this line pretty much every week now, on LinkedIn, on YouTube, in vendor demos and Reddit.
I get why it's said. Most of the time it's shorthand, a way of illustrating that AI is faster than a human developer. Fair enough, it is faster, a lot faster. I have no issue with that.
Here's the thing though. The more people I speak to about this, the more I find they genuinely stand by it. They believe that three minutes in, they have something ready for the business. I'd say they've been misled and it's worth unpacking why.
Can AI build a dashboard in minutes? The short answer
Yes, AI can produce a working dashboard in minutes, and that is a real step forward. What it produces in those minutes is a first draft. Getting from that draft to a dashboard people use, trust and act on takes many iterations, even if you look purely at the development work. AI makes each iteration quicker, it does not remove the need for them.
Key points
- The "dashboard in 3 minutes" line is often used to illustrate speed, which is fair, but many people now take it literally.
- A quick first build is iteration one. The end product comes many iterations later.
- Even on the development side alone, a real dashboard goes through rounds of checks, fixes and feedback.
- A chat interface asking "what do you want?" and handing back a result is the "what do you want" dashboard, just faster.
- At Metis BI, we use AI for the development work, but we still do the thinking, in fact more of it now.
Yes, dashboards in minutes is possible now
As I've written more than once, most recently in The Dashboard Is Dead? Not Quite, and AI Is the Proof, the "dashboards are dead" narrative (yeah, right!) never held up. Building one has never been quicker.
Claude Dashboards builds them from a plain English question. In MS Fabric, Fabric Apps (still in preview) lets developers build full data apps on top of lakehouses, warehouses and semantic models. On the Power BI side, agentic development has moved fast, with Microsoft now documenting Power BI Agentic, a set of agent skills and tools that let AI coding agents create semantic models and reports from natural language.
So, can you get a dashboard on screen in a few minutes? Absolutely. Does that mean that a few minutes later you have something that is used, adopted and actually helps improve the decision making process? Not at all.
Minute three is iteration one
Let me be clear on scope for this one. I'm focusing purely on the development side. I'm deliberately leaving out the work that has always mattered more (and matters even more now with AI), everything you do before you touch the tech. I've covered that plenty and I'll come back to it briefly below.
Even with AI doing a lot of the heavy lifting on the build, it takes many iterations. And I mean many. Here's a flavour of what some of those iterations look like on a typical build, at least in our experience:
- Numbers that look right but aren't: the total matches, but the monthly split doesn't reconcile with the figures finance signs off. Back you go.
- Calendars: a first draft will often assume a calendar year, but plenty of UK organisations run an April to March financial year, so year to date and prior year comparisons get reworked.
- Knock-on effects: you ask AI to fix one thing, and it quietly breaks something else. Rename a measure and a visual on another page can lose its field. Fix the year to date logic and the prior year comparison can drift. So every fix means re-checking what was already working.
- Measures in the wrong place: AI puts the right measure in the wrong spot on a visual, say on the axis instead of the values, or in the tooltip of the wrong chart, and it looks fine until someone actually reads it.
- Definitions: the measure is called "Active Customers", but nobody has checked it against the definition the business actually uses. This is a big part of why the semantic model matters even more with AI.
- Business language: field names, titles and tooltips come straight from source columns, so they get rewritten into words the audience uses.
- Security: row-level security needs setting up and testing with real user roles.
- Performance: a visual that's fine on a sample can crawl on the full semantic model.
- Feedback rounds: someone sees the prototype and says "that's useful, but what I really need to see is...". This is a good thing, it's the whole point of showing a prototype early.
Each one of those is a loop. Spot it, prompt or fix, test, check again. Some of them several times over. AI makes every loop quicker, sometimes dramatically so.
AI shortens each iteration. It does not remove them.
On a recent build, the first AI-generated version took a matter of minutes. The version that went live was after MANY iterations.
I mean, yes, sometimes a quick first version is exactly what you need. An exploratory question, a one-off piece of analysis. That's fine. But that's a different thing from the dashboard a team is meant to run part of the business on.
The "what do you want" dashboard, just faster
Don't be led down the path that AI is doing more here than developing a dashboard. Look at what actually happens in most of these demos. The AI asks, in one form or another... what do you want? You tell it, and it hands you a result.
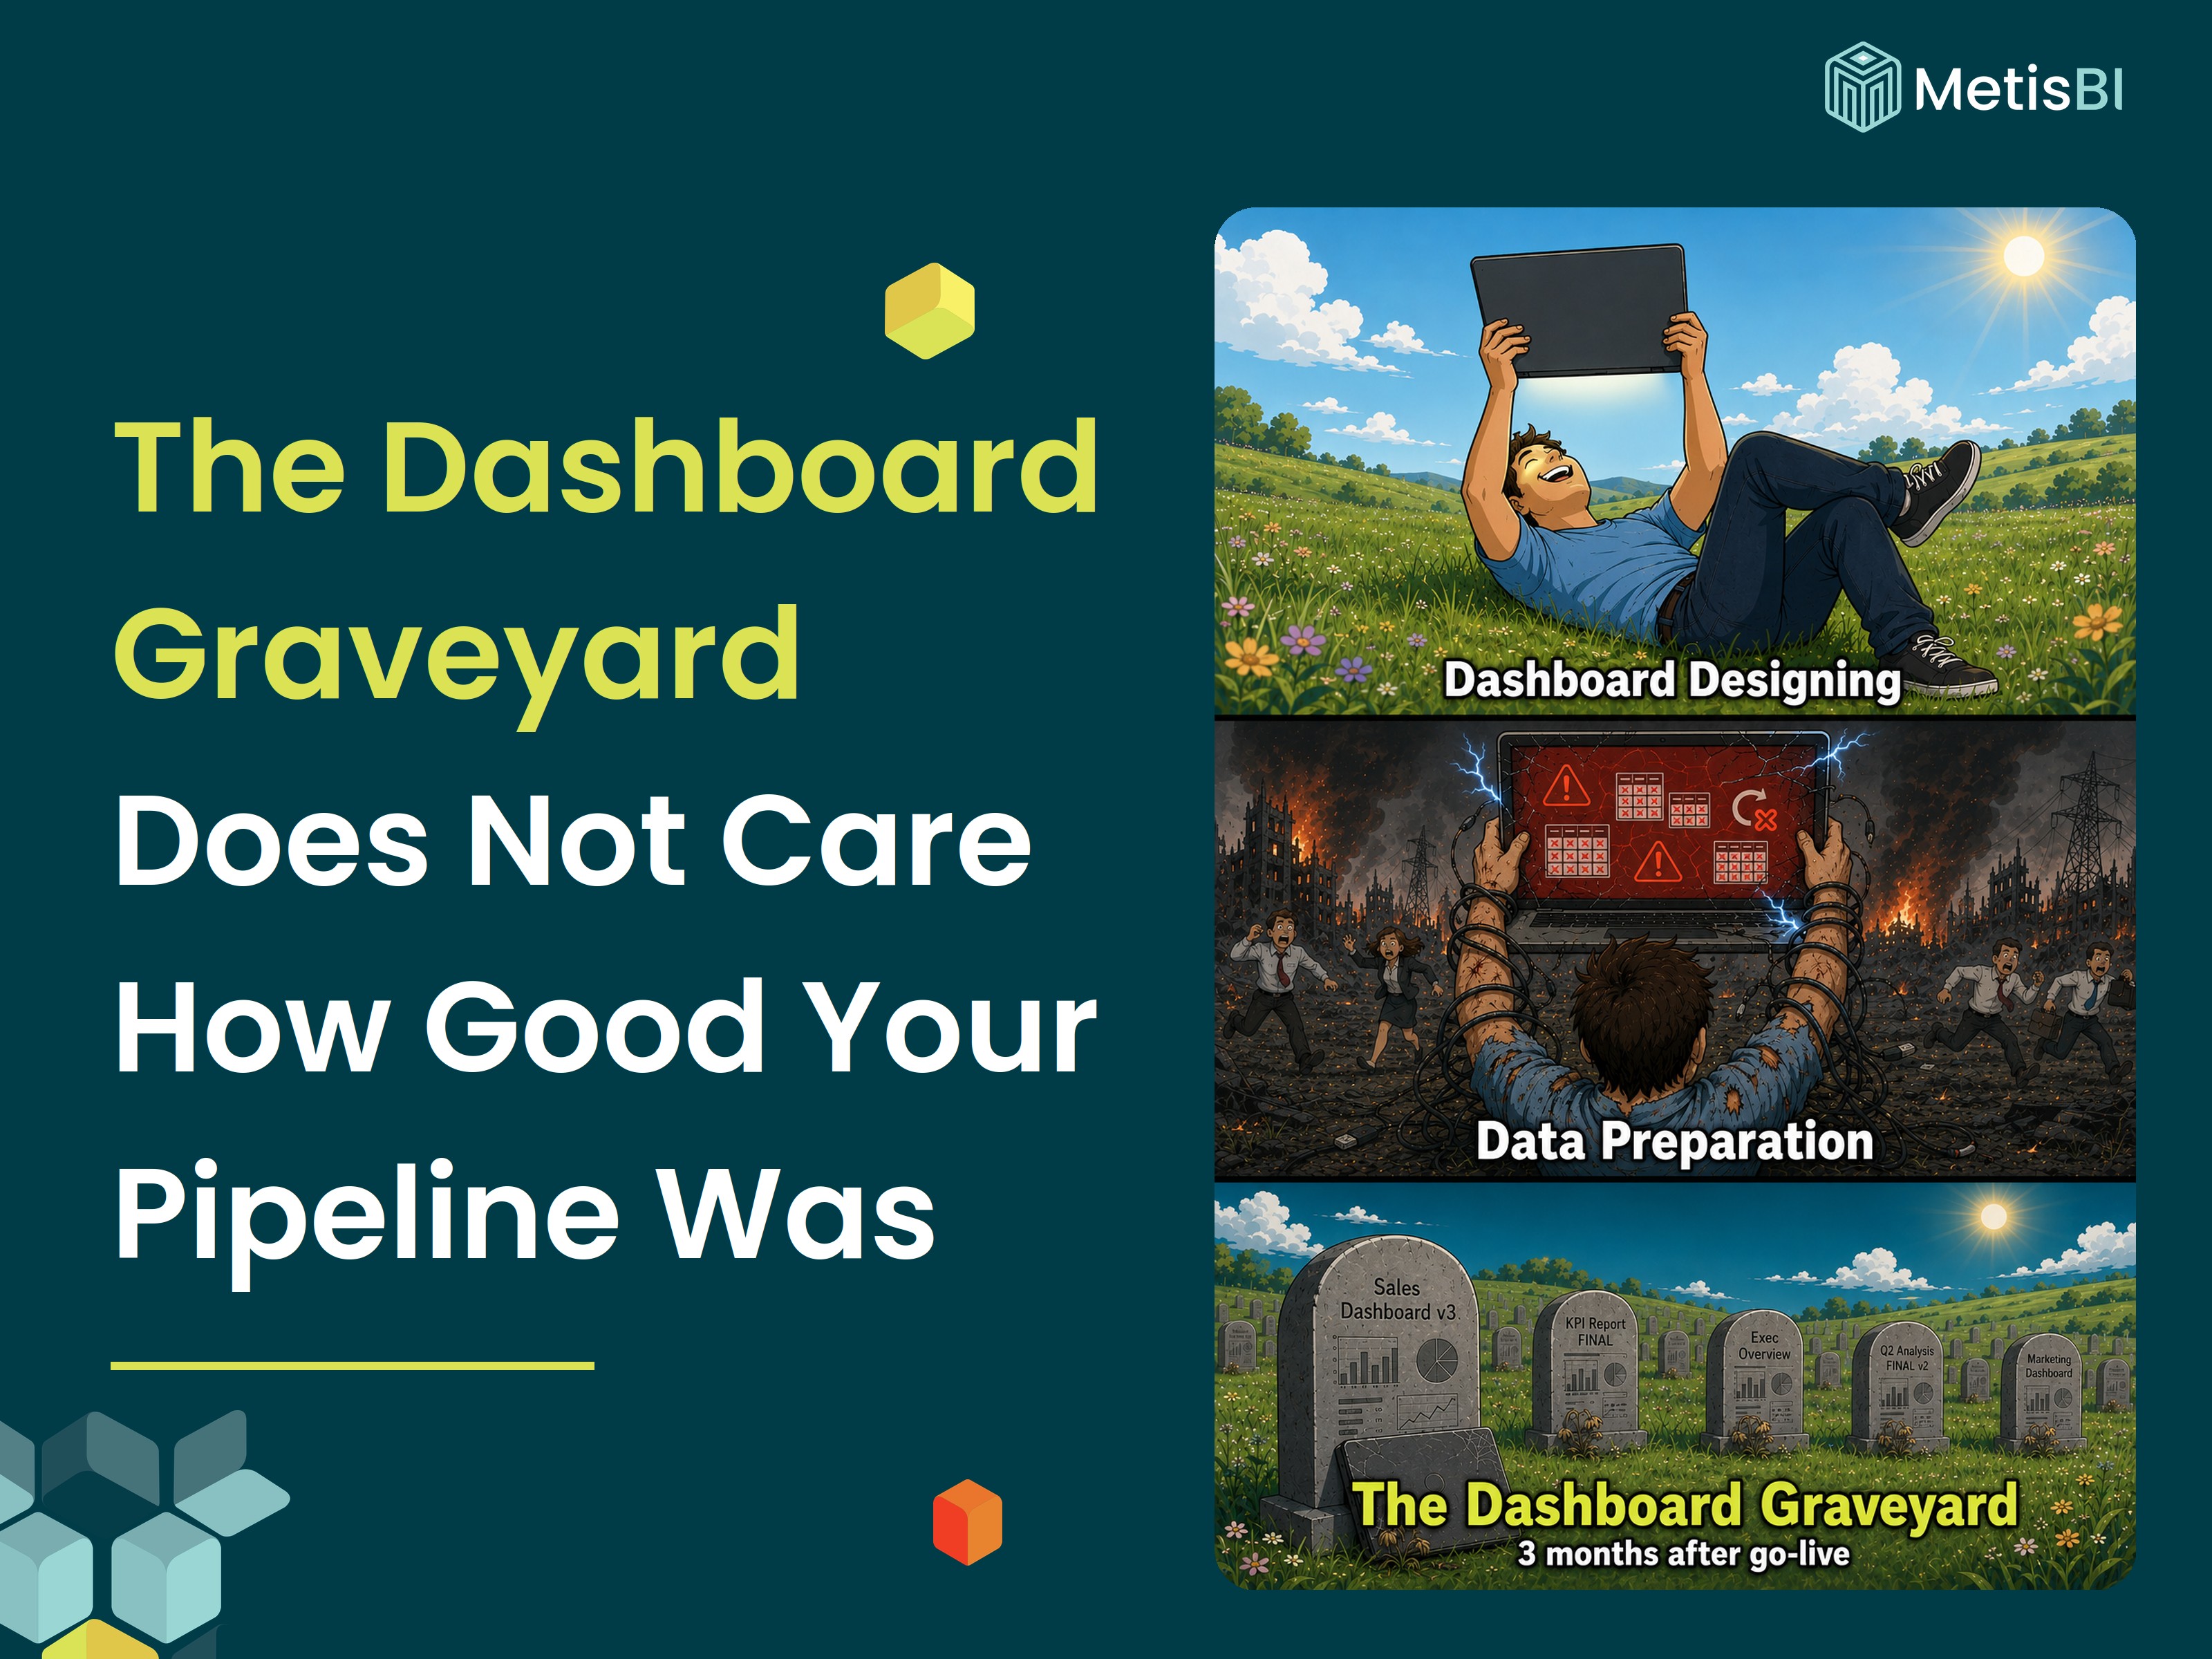
That's what I like to call the "what do you want" dashboard. It's the same approach that binned so many reports over the years, the BI team asking what you want, going away, and coming back with something. The only difference now is that it happens in minutes instead of weeks.
That can't be the end product. It's a starting point, at best.
Am I closing my eyes to AI?
Absolutely not! We use AI a lot at Metis BI, across design work, semantic models, testing, report development and plenty more besides. The way I explain it to clients is simple. We use AI for the development work, but we still do the thinking. In fact, we do more of it now than we ever did.
AI is wonderful for this work, and I genuinely mean that. It unlocks the capability to develop solutions you simply would not have been able to build before. It lets us deliver at speeds that weren't realistic a couple of years ago. It takes on the small, tedious tasks nobody misses doing by hand.
What it does not do is replace the expertise I've always pushed. If anything, it means that expertise is needed more:
- Integrate with the business: go and sit with them early, before a list of requirements lands in your inbox.
- Find the right stakeholder groups: including the people who will actually use the thing day to day.
- Understand their genuine challenges and goals: where they are trying to go, and what is getting in the way.
- Listen, then challenge: push back professionally when a request doesn't serve the goal.
- Keep them accountable: for the purpose, KPIs and actions that were agreed.
Then develop with AI. In that order.
Do the thinking first, then let AI speed up the build.
I've written before about how this changes what a good developer looks like, in why report developers need more than technical training. AI only makes that blog more relevant.
If you've been shown a dashboard built in three minutes and want to know what it really takes to get one used, this is the work we do every day. At Metis BI, we pair AI-assisted development with everything around it, requirements gathered with the people who will use the report, agreed KPIs and definitions, early prototypes the business can react to, and the many rounds of testing and refinement before anything goes live. It's for BI leads and business teams who want reports their people actually open and act on. It won't guarantee every report lands, but it gives adoption a far better chance. Learn more about our Power BI report development services.
Summary
AI can put a dashboard on screen in minutes, and that's genuinely useful. When people say it to illustrate speed, they're right. Where it goes wrong is when it's taken literally.
Minute three is iteration one. Even looking purely at development, getting to something people use takes many iterations, AI just makes each of them quicker. The "what do you want" dashboard is still a "what do you want" dashboard, however fast it arrives.
Use AI for the build, keep doing the thinking, and expect to iterate. A lot.