




I have built this dropdown for clients more times than I can count. Last week I built thirty-six of them in a day, thirty cloned from the six I signed off in the morning and I did not touch a single bookmark.
Hold on... let me explain that properly, because the wow is not really the speed.
For the best part of a decade I have been bending native Power BI visuals, shapes, buttons and other items into things Power BI does not do out of the box. Shapes, buttons, bookmarks, measures that return SVG, glued together so a report looks like the client's product rather than a Power BI report. I got known for it in previous roles, and the same instinct was there before Power BI in TIBCO Spotfire, Board MIT and MicroStrategy. I loved it and I still do.
Here's the thing though. The tenth rebuild of the same pattern is not creativity, it is admin and repetitive. Clients keep asking for the same look and feel (fair enough, it works), and every rebuild is another chance to save a bookmark with the wrong tick box and to speed up the overall delivery.
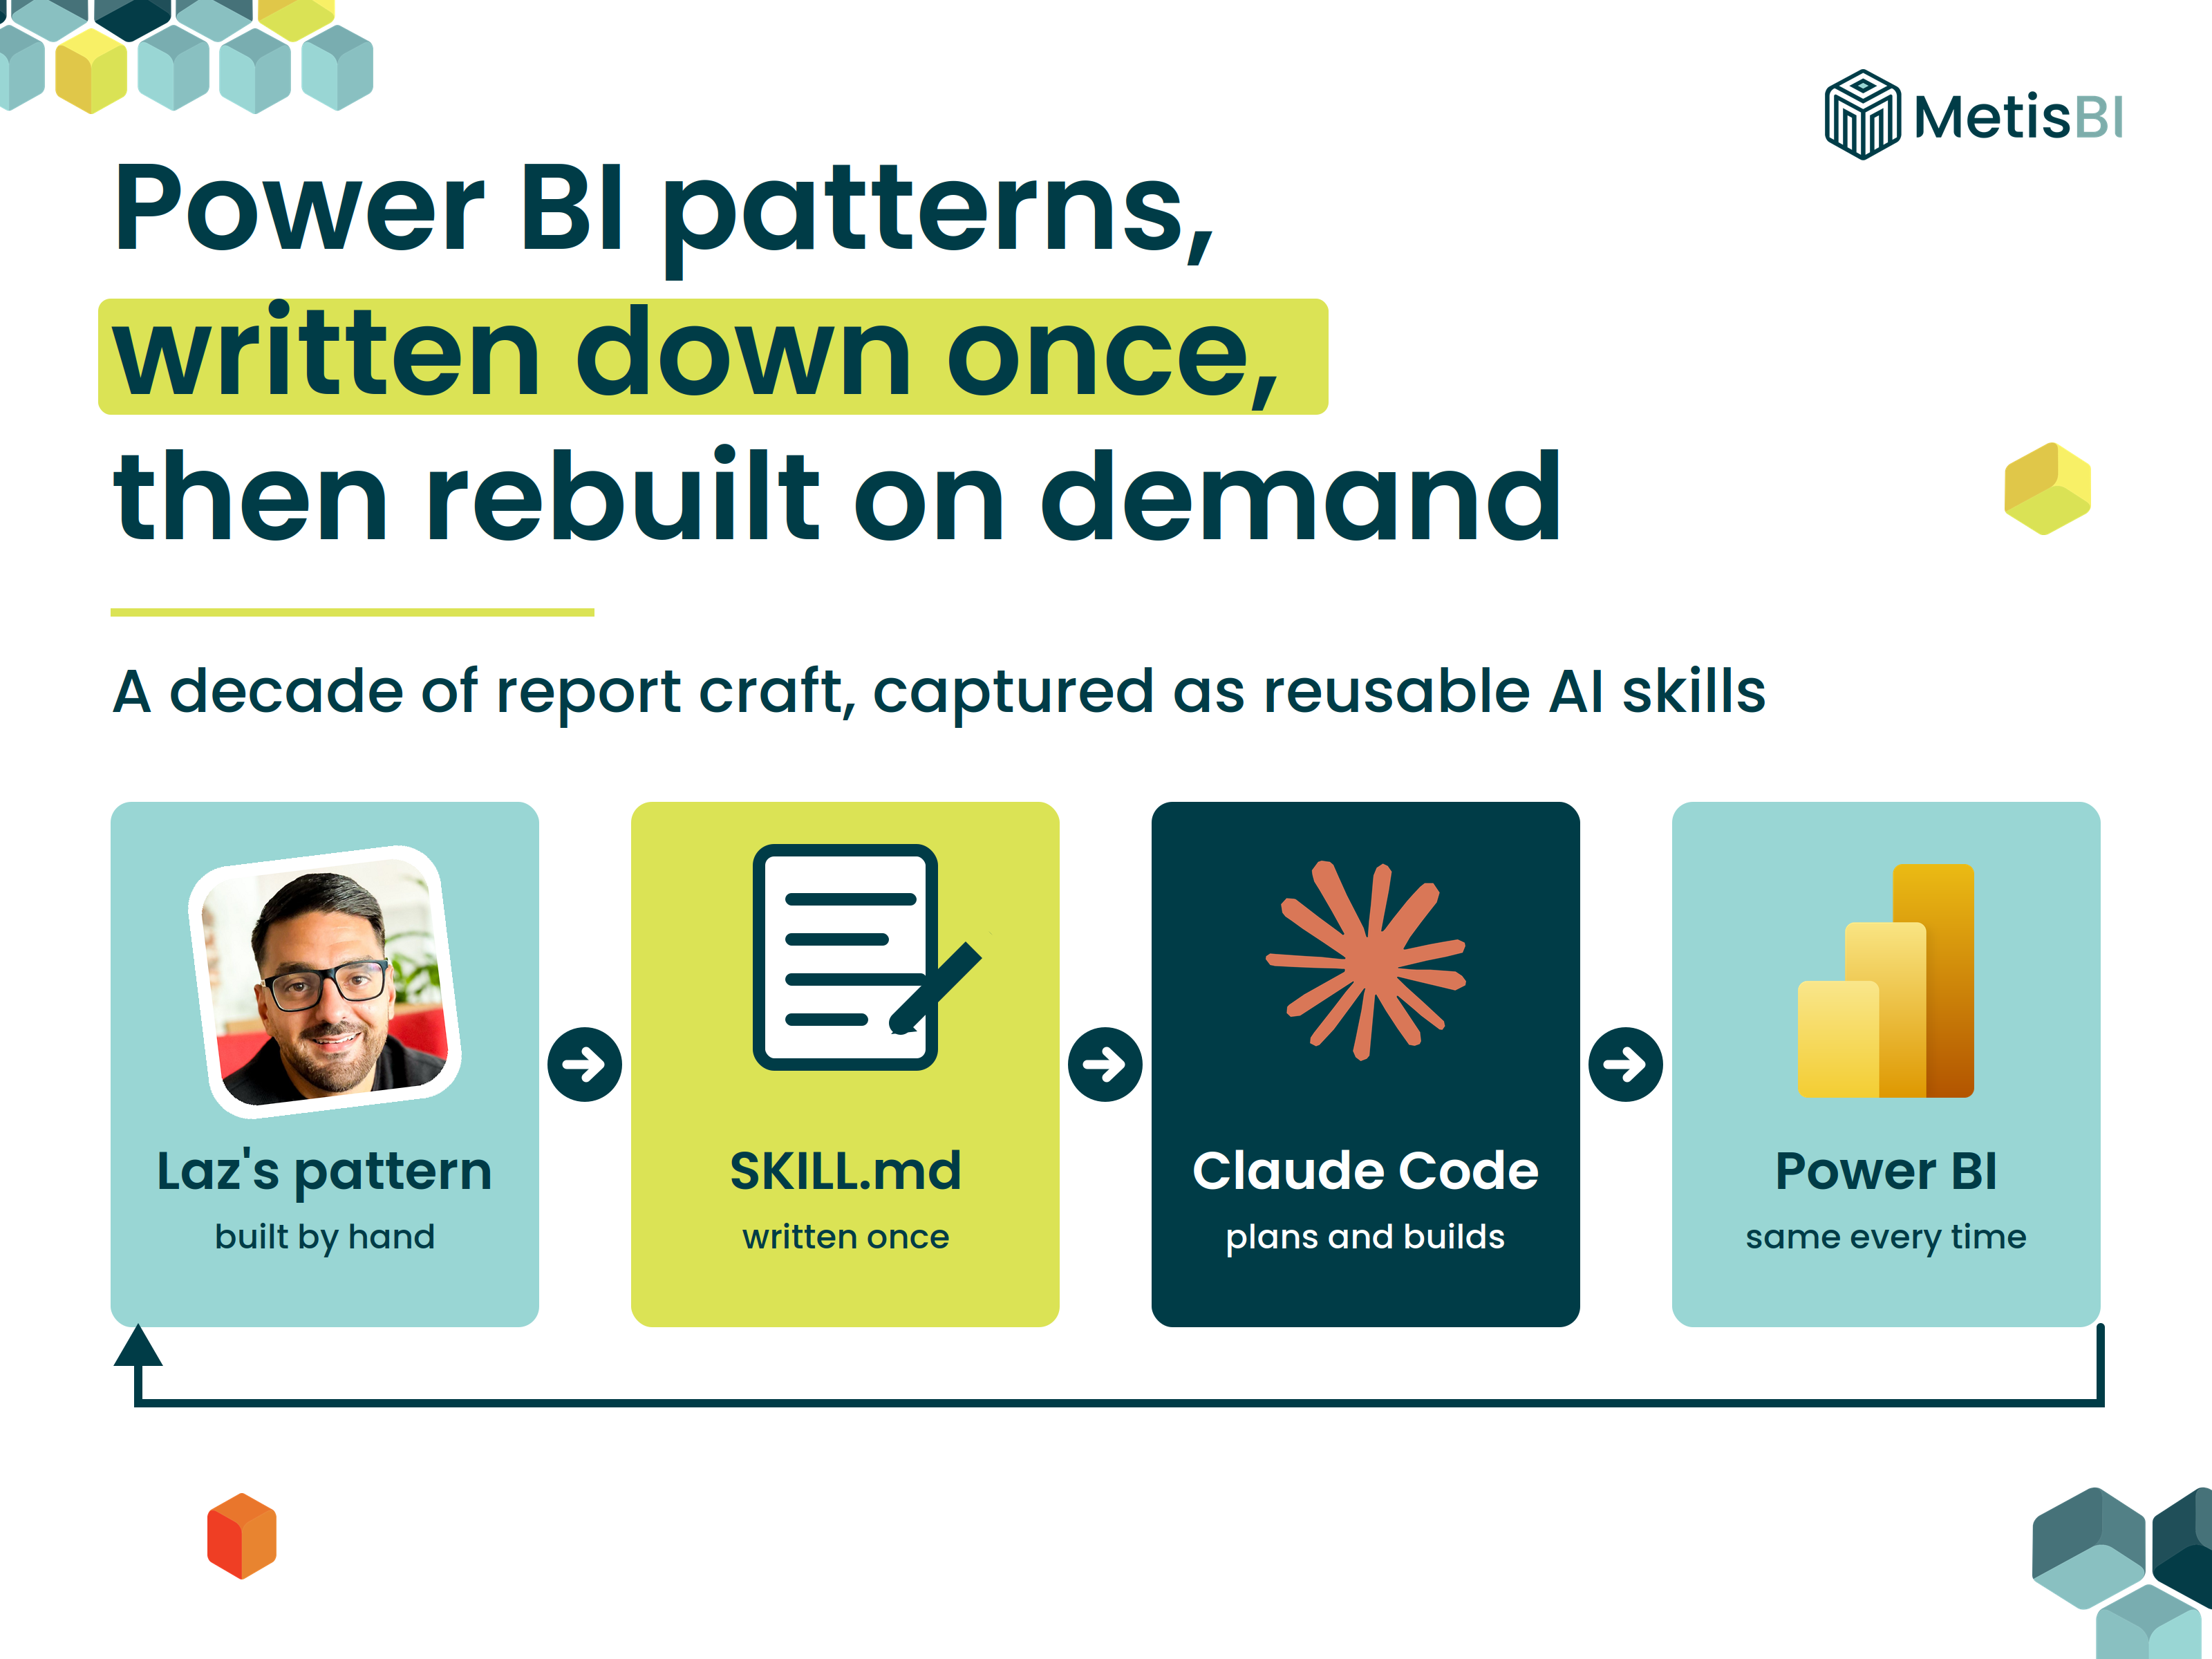
What changed for me this year is simpler than the technology. The report has lived on disk as files an AI agent can read and write for a while now and this year I finally sat down and wrote down my patterns that I have collected over the years. The pattern is the asset. AI does not invent it, it removes the cost of reproducing it.
What this blog covers
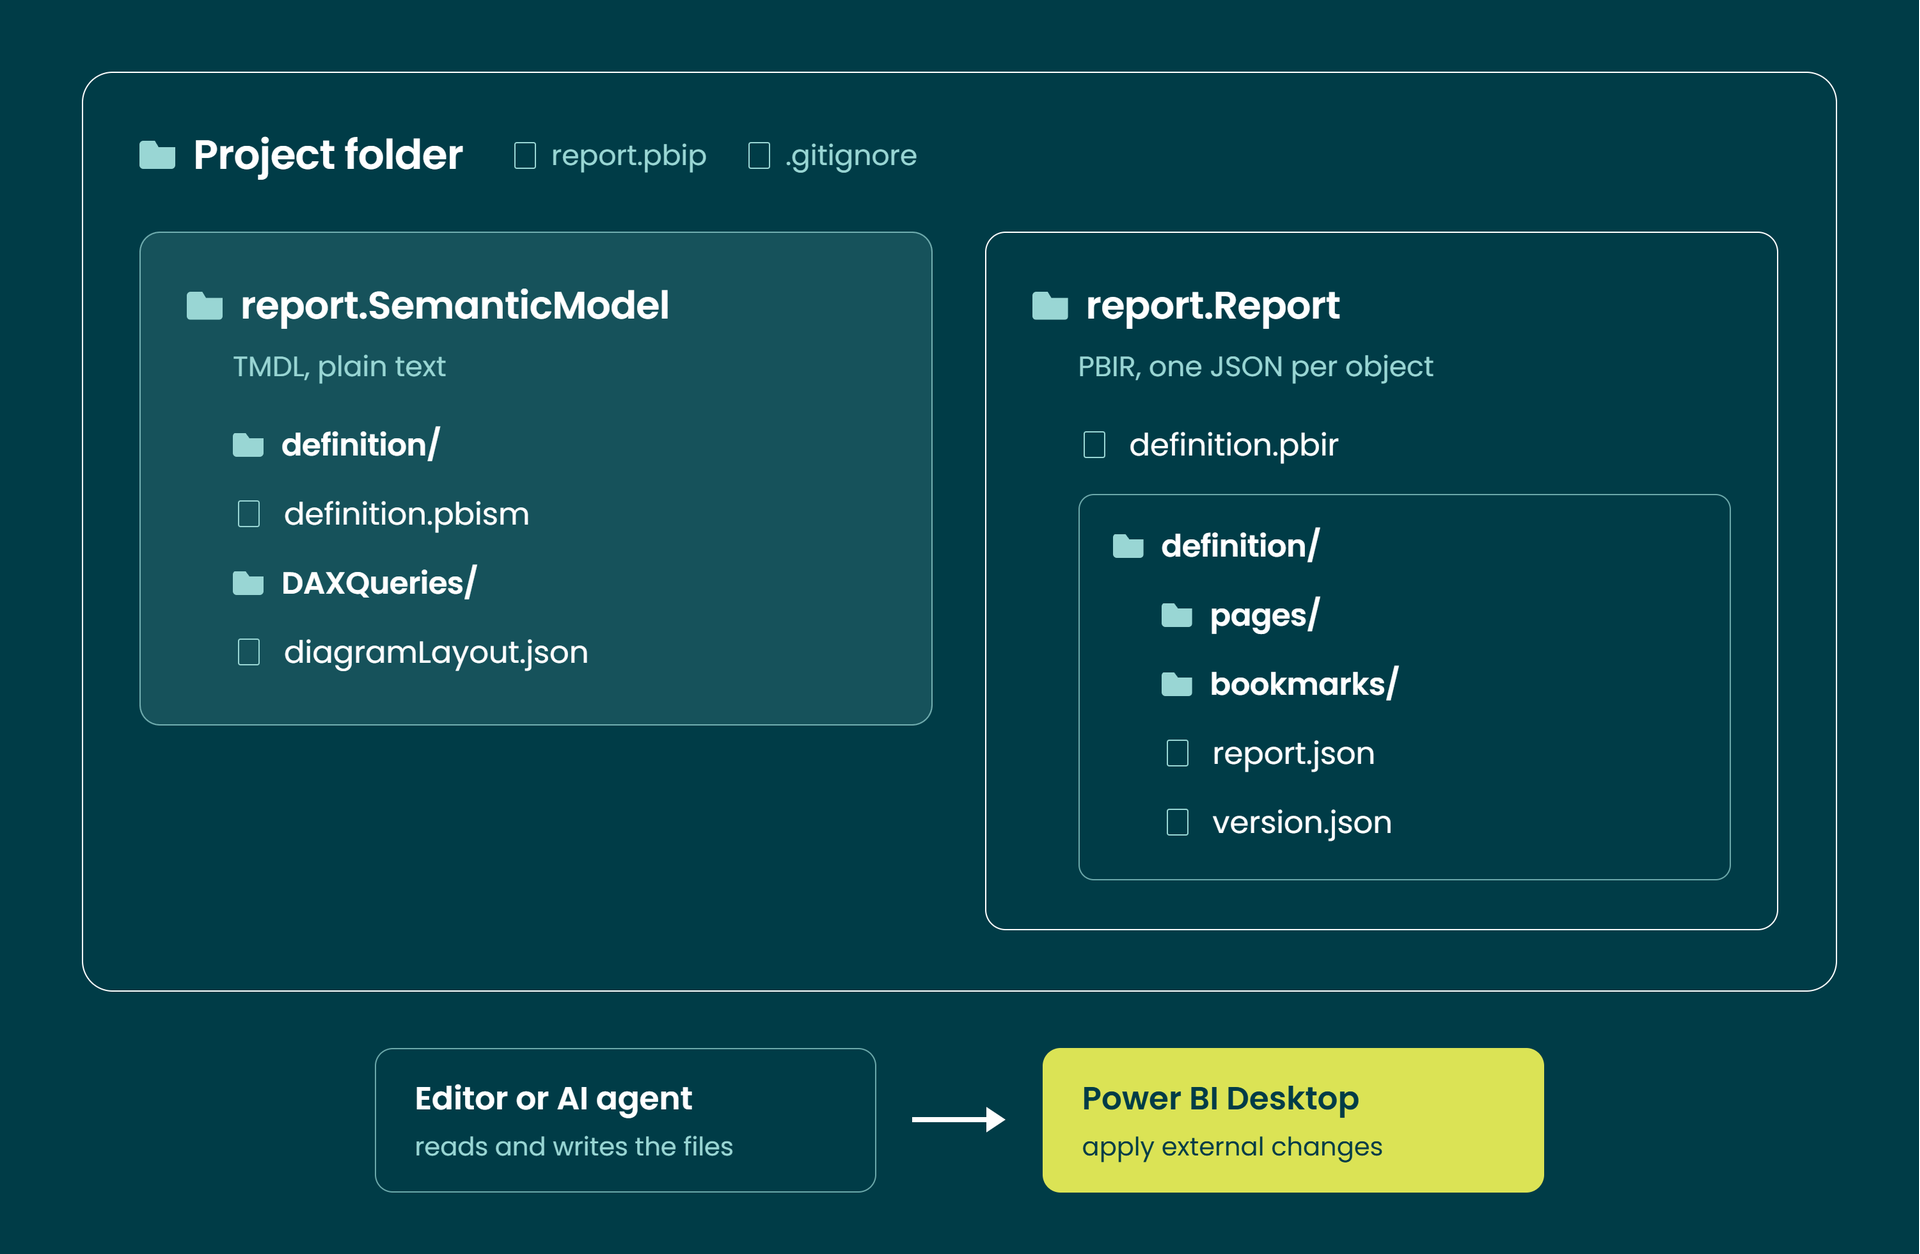
A Power BI pattern, the way I use the phrase, is a combination of native visuals, measures, sync slicers, bookmarks and other items depending on the pattern, that produces something the product does not offer natively. With Power BI Projects (PBIP), the report and semantic model are stored as TMDL and JSON files, so an AI agent such as Claude Code or GitHub Copilot can read and write them. Below is a high level overview of the PBIP structure:
A skill is a folder (a SKILL.md file plus reference files) that describes one pattern once, so the agent rebuilds it the same way every time. The developer still designs the pattern, approves the plan and checks the result.
Key takeaways:
- The value is in the pattern you have refined over years, not in the agent. Writing it down is the hard part and nobody had done it.
- PBIP puts every visual, page and bookmark on disk as a readable file. That is what makes this possible and key difference with PBIX.
- Watching an AI agent rebuild your own pattern exposes bugs and hidden rules you had been carrying for years. It also helps optimise it in more ways.
- The AI agent's best moment was analysis a person would not have bothered with, proving which measure can safely drive a slicer filter.
- The method matters more than the file: build the pattern by hand first, extract it, then correct the rules against what is actually on disk.
What changed, the report is a folder now
For years the report was a black box inside a PBIX. You could open it in the app and click around, and that was your lot.
PBIP changed the game. Save a report in Power BI Desktop as a project and the semantic model is written as TMDL and the report in the enhanced report format, PBIR, one JSON file per page, visual and bookmark, all plain text you can diff. Edit a file outside the app and Desktop prompts you to apply the external change. If you have never used PBIP, that banner will be new to you, and it is the moment the whole thing clicks. The canonical starting point is the Power BI Desktop projects documentation. On top of that I use Claude Code, a command-line agent that reads and writes those files, plans before it acts and can be told to stop, and Microsoft's Power BI Modelling MCP Server (public preview) for measures and relationships against the live model. Notice what has not changed: the semantic model is still the centre of gravity and none of this works well on a messy model.
The worked example, a dropdown that looks like the client's, not Power BI's
I could have picked any number of examples here, because I have plenty of these patterns. But the pattern itself is not the point. The point is turning it into a skill, so it can be repeated easily and becomes part of your armoury of things you can just implement. So I picked this one because it is the simplest to explain, not the most impressive.
What native gives you today
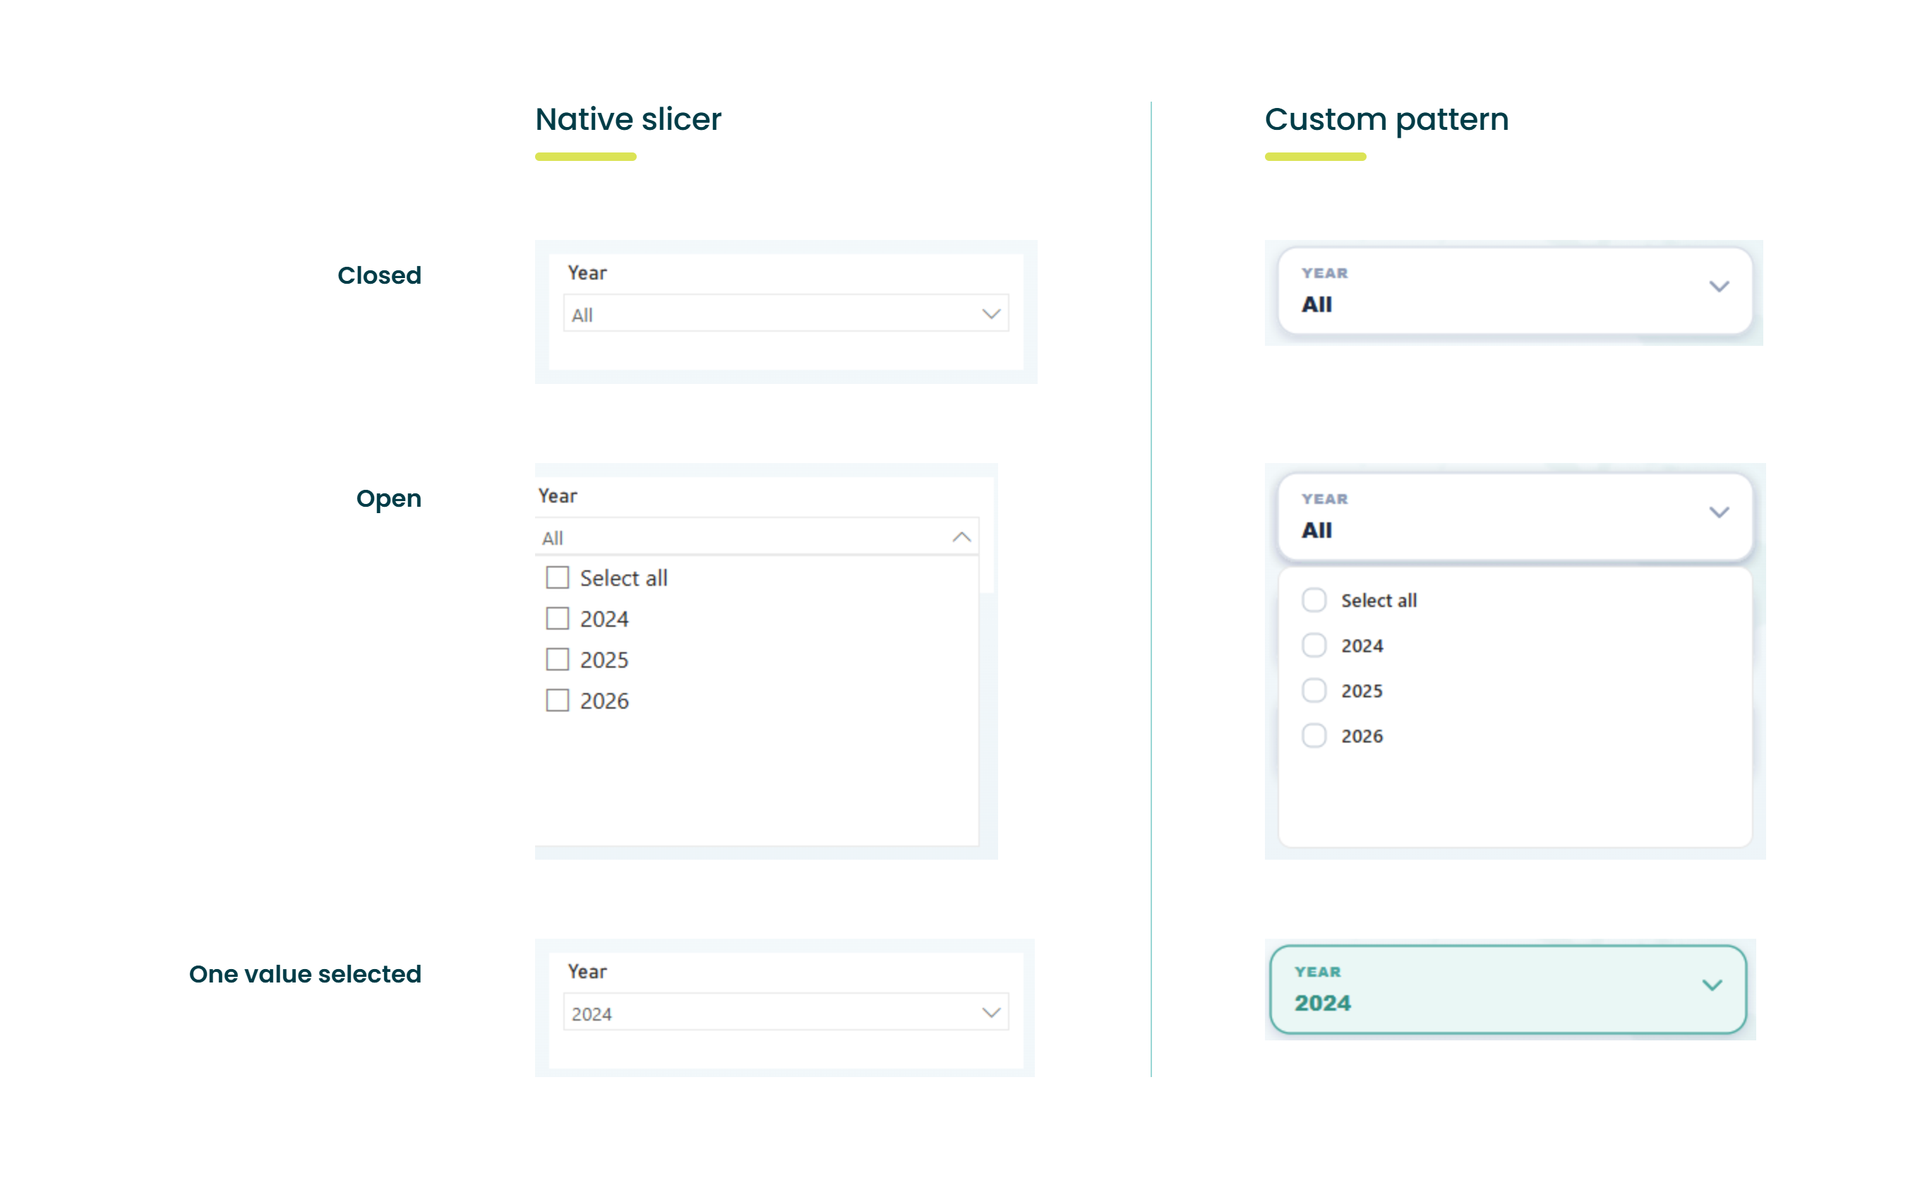
Let me be fair to Power BI first. The August 2026 update added a Dropdown section to the slicer formatting pane, with border colour, rounded corners, open icon colour and an accent bar. Good release, and it retires a couple of workarounds I used to carry. The newer list and button slicers are lovely too, although neither has a dropdown mode.
What it still cannot do is deliver the exact design the client approved. No conditional formatting on the value text, so the face cannot carry my own wording or stay consistent with how selections are shown elsewhere on the page; no room in the collapsed box for the label-above-value layout, because the field name sits outside it; and square checkboxes in the open panel with no option to round them. Each is small. Together they are the difference between close and signed off.
Curious where I land on native visuals vs SVG measures vs HTML more generally? I have written that up here: SVG Measures vs HTML in Power BI: A Native-First Guide.
What the pattern is made of
Per filter, three visuals and two bookmarks:
- An Image visual bound to a measure that draws the collapsed face: the label, the current selection and the caret. It changes colour when a filter is active and because the whole face comes from a measure, every pixel is controlled in DAX.
- A native list slicer, styled, as the open panel.
- A close target visual over the face, shown only while the panel is open.
- Bookmark Open shows the panel and close target and hides every other panel on the page. Bookmark Close reverses it. Both capture display only, never data, so opening one filter never resets another.
A shared selection measure returns one of three states: All, the selected value, or Multiple.
What the Power BI authoring skill contains
Two files, really. SKILL.md holds the rules, all of them, from anatomy and naming through build order, measure templates, colour tokens, bookmark and layering rules, a verification checklist and the known limits. Beside it sits a references file with the exact JSON and DAX of one working instance, generated from disk by a small script so it never drifts.
A good skill records the variants too. This pattern has two faces, a compact pill for the header bar and a taller card for the filter page, each its own measure, and the skill says which to use where. The point of writing it down is to capture the choices, not just the happy path.
Now the scale. Six filters on one page is 18 visuals, 12 bookmarks and 18 measures, and each Open bookmark has to reference 12 visuals correctly. Then the bar repeats on other pages. By hand that is a day of clicking and a week of finding the one bookmark saved with Data ticked. With the skill it is a plan, an approval and a click-through.
How I actually built the skill
I did not sit down and write the skill. That was the mistake I nearly made.
What worked was the opposite order. The pattern already existed, built by hand on one page, refined over years. So the first job was to write the rules down from it: anatomy, naming, build order, the colour tokens, what the bookmarks must and must not capture. That took a short time and it was mostly transcription.
Then the step that made the difference. I had the agent extract the exact JSON and DAX of the working instance straight off disk into a reference file, generated by a script so it can be regenerated rather than hand-edited. That extraction is where the skill got honest. My naming conventions did not match what was actually on disk. The measures were sitting in a table I had marked for deletion. There was a third measure I had forgotten I was using. And the one-open-at-a-time rule I had written as fact was not implemented anywhere. I corrected the skill against reality before I used it once.
Then I used it, on a single page, with the agent producing a plan and stopping before writing anything. Every mistake it made became a new rule. When I hand-tweaked the result in Desktop afterwards, I had the agent read my changes back into the skill, so the file described what I had approved rather than what it had built.
Only then did it replicate, cloning from the approved instance rather than rebuilding from the spec. Build by hand, extract, correct against reality, use once, tweak, feed back, replicate. That is the whole method and the corrections in step two are where most of the value sits.
If you have patterns of your own and would rather not spend a week discovering all this yourself, that is the sort of thing we do at Metis BI.
What I learned watching an AI agent build my Power BI pattern
Every one of these came out of the extract-and-correct step or the first build, and every one is now a line in the skill. That is what the method is for.
The best moment was analysis I would never have paid for by hand. Two list slicers were not narrowing or filtering each other. So, pick a value in one and the next still shows everything. That is single-direction relationships doing what they are told, the filter reaching the fact table and stopping there. The fix is to get a measure into each slicer's query, a simple "is not blank", so it evaluates through the fact (or a M:M relationship but that is an entirely separate blog).
Now, the real question is which measure and this is where the agent earned its keep. It compared the distinct key combinations across every fact table and proved that a row count over the central fact, the one everything else relates to, matches the union of all facts under any filter, where a count taken from a peripheral fact would silently hide values that only have data elsewhere. Three measures already in the model passed every test, but only by luck: every key happened to exist in that one fact, and a future load could have broken them quietly. The recommendation was a purpose-built hidden measure whose only stated job is slicer filtering. That went into the skill as a rule, not a suggestion.
Then the catalogue of things that only surface when something does the work literally enough to trip over them.
- The agent found bugs in my hand-built original: the solution I extracted the skill from did not actually implement one-open-at-a-time; its bookmark only targeted its own visuals. Nobody had noticed, because it was the only one on the page when I built it. Writing the pattern down is what exposed it.
- Bookmarks in PBIR only act on visuals listed in targetVisualNames: anything captured in the snapshot but not listed is inert. This is invisible in the Desktop UI, and it is exactly the kind of thing that breaks silently on the fifth copy. It is now a verification step, not a footnote.
- Visual groups are stacking contexts: a list nested in one group cannot overlay something in a later group, whatever the z values say. The agent proposed dissolving the groups. My fix was simpler: reorder them so the top row sits highest, because a list only ever drops downwards. That worked, and it went into the skill with its precondition stated, so nobody has to rediscover it. The agent did the cataloguing; the fix was still human.
- Some properties are load-bearing: the agent removed a group's scale mode to test a theory about a small rendering drift and most of the page stopped rendering. It reverted at once, and the skill now says scale mode stays on, every group, no exceptions.
- Moving a measure between tables rewrites every visual binding: two shared measures touched 78 references across 13 visuals. Mechanical for an agent, error-prone for a person, and a good argument for letting it do the boring half.
None of those are AI insights. They are Power BI insights, and the agent was simply the first thing patient enough to hit all of them in one day. If you write your own skill, expect the same: the value is not the file, it is what writing the file forces you to notice.
The discipline matters more than the tooling
I always tell my clients the rules around automation matter more than the automation, and this was no different. The rule that cost me real time was not the obvious one.
The obvious one still holds: save in Desktop before the agent writes and back up before every pass. But the one I learned the hard way is the reverse. After the agent writes, click Apply external changes in Desktop before you save. Save first and it writes its in-memory copy back over the agent's files. That happened three times in one day, dropping bookmark registrations twice and an entire bookmark file once. The AI agent added the rule to CLAUDE.md itself and sharpened the wording after the second time. Two smaller rules earned their place too: a live-connection change does not always flip Desktop's unsaved flag, so Save can silently do nothing, and you rebind a visual in place rather than deleting and recreating it, which loses the formatting and every bookmark reference.
The part that made me trust it was the honesty, not the cleverness. It once refused to reload because it could not confirm Desktop was clean and said so rather than guessing. Another time a bookmark audit flagged 24 unregistered bookmarks and 6 phantom index entries; before deleting anything it re-checked, found the bug was in its own parser (the phantoms were the folders, the unregistered ones their children) and touched nothing. Deleting them would have orphaned 23 bookmarks. And when a defect was still open at the end of a pass, it opened its report with "this is not a pass" rather than burying it.
None of this is hands-off and I would not want it to be. I hand-tweaked slicer sizes, reordered groups, dragged a frame in Desktop. The point is not that the human disappears, it is that the human stops doing the parts that were only ever admin.
The other patterns waiting for the same treatment
If you have built reports for a while, you will recognise most of these.
- On-canvas filter summary chips, always visible, export-safe, sized per filter.
- Bookmark-driven pop-ups and help overlays with a single close convention.
- Card-style KPI tiles with SVG icons and conditional state colours.
- Step indicators and page navigators built from bookmarks.
- Conditional visibility via transparent colour measures, because there is still no native "hide when" for a visual.
- Custom tooltip pages with a fixed header pattern.
- Bookmark organisation itself, as a pattern. One level of folders (the Bookmarks pane allows no sub-folders), one folder per page, every bookmark named page code first so names sort into feature blocks and 10 does not land after 1. On this report that turned a flat list of 110 bookmarks into nine tidy folders, with all 272 visual actions still resolving afterwards because the ids never changed.
You will have your own. The question I would ask is whether any of it is written down anywhere other than in your head.
Why this matters beyond one report
A written record of craft is the part I care about most. The patterns used to live in one person's head, mine, which is a risk for the client and for Metis BI. Now they are files in a project, reviewed and versioned like anything else.
At Metis BI we build Power BI experiences to a client's design system rather than Power BI's defaults, and we now capture those patterns as skills so AI-assisted delivery is faster and more consistent from the second page onwards. It suits teams who want reports that look like their brand and behave like their product. If that is you, learn more about our report BI development services.
Summary
I did not set out to replace anything. I set out to stop rebuilding the same dropdown, and along the way I documented a decade of habits for the first time, found bugs in my own work and ended up with rules a new developer could follow tomorrow.
The AI did not make the pattern better. Writing it down did. The agent just made writing it down worth the effort.
If you finish this thinking "I have five of these and I have never written any of them down", good. That was the point. The patterns are already in your team, in the heads of whoever built your best-looking reports. Getting them onto disk as skills is what turns them into something the whole team can build with, at speed, the same way every time.
That is work we do at Metis BI: getting Power BI teams developing with AI properly, optimising the workflow, capturing what your developers already know as reusable skills and putting the workflow discipline around it so it is safe on client delivery. If you want your team building faster and more consistently, get in touch and we will show you what it looks like on your own patterns.


.png)
.avif)